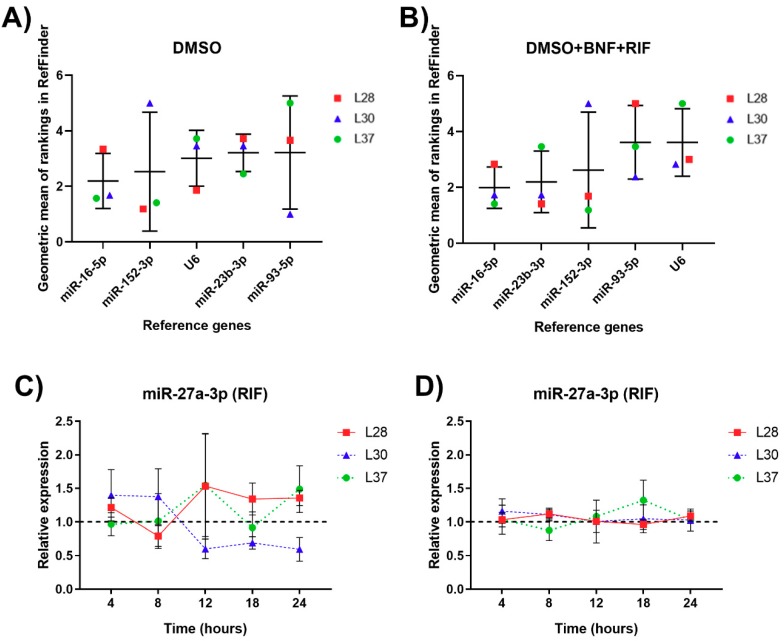
Figure 5.
RefFinder ranking of miRNA RGs with individual values in PCLS within 24-h incubation in the control (A) and treated group (B). Relative miR-27a-3p and miR-203a-3p expression under the effect of RIF 10 µM (C) and BNF 10 µM (D), respectively, normalized to a geometric mean of miR-16-5p and miR-23b-3p. Results are presented as mean ± SD (n = 3).

