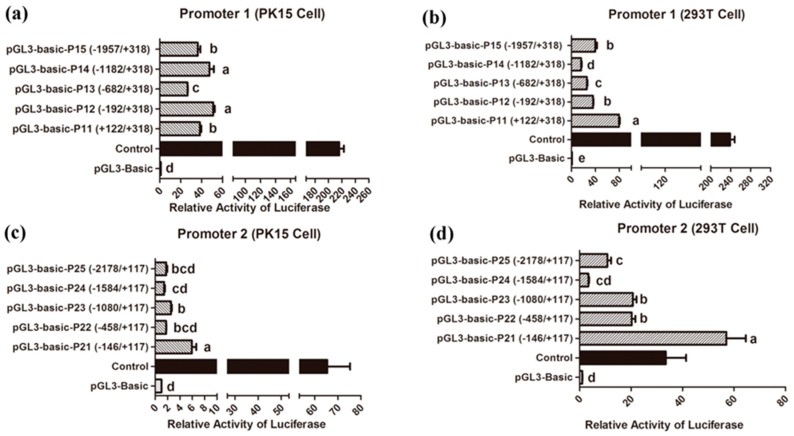
Figure 6.
Promoter activity analysis for the two transcript variants of porcine Prox1. Promoter activity analysis for Prox1 transcript variant 1 (Promoter 1) in PK15 cells (a) and 293T cells (b). Promoter activity analysis for Prox1 transcript variant 2 (Promoter 2) in PK15 cells (c) and 293T cells (d). The left side of the x-axis represents a series of truncated 5′-flanking sequences of Prox1 that were fused to the firefly luciferase reporter gene in the pGL3-basic vector, and their positions were defined relative to the transcription start site (+1) of porcine Prox1. The right side of the x-axis indicates the relative luciferase activity of promoter fragments. Here, pGL3-basic and -control were the negative and positive control vectors, respectively. The pRL-TK vector encoding Renilla luciferase was co-transfected as the internal reference. Promoter activity was defined by the normalization of firefly luciferase activity to Renilla luciferase activity, and the value of pGL3-basic negative vector was defined as 1. Data are presented as the mean ± SEM (n = 5). Statistical analysis was performed in SPSS 20.0 using one-way ANOVA test with Duncan’s multiple range tests. Data are presented as the mean ± SEM (n = 5). Different letters above the bars indicate significant differences. Note: p < 0.05.

