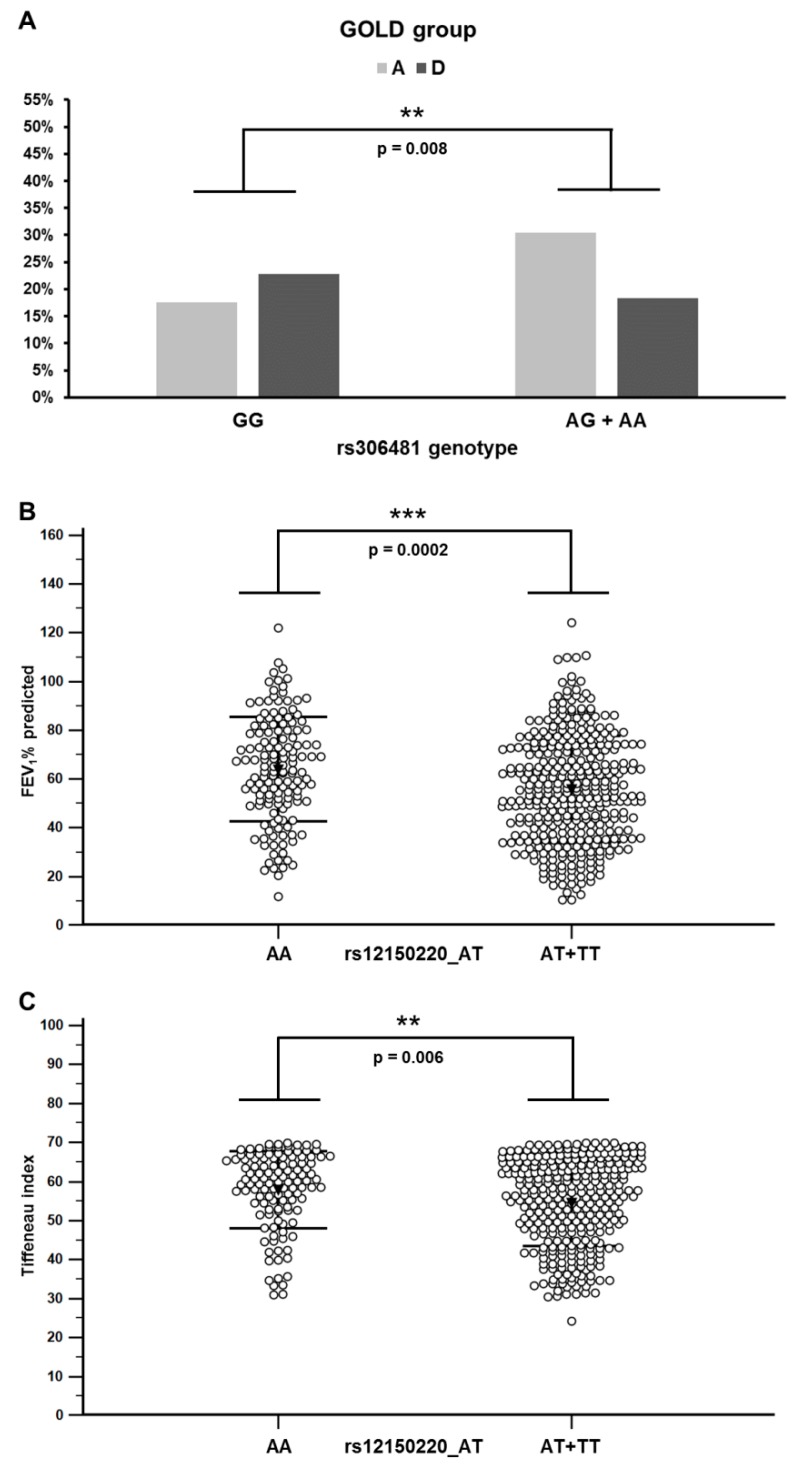
Figure 2.
Distribution of the GOLD groups among rs306481 genotypes and the association of the rs12150220 genotypes with spirometric parameters in COPD patients. (A) Allele A carrier status in the tested locus correlated with the milder GOLD stages; refer to Table 3 for the results of the statistical analysis. Numbers present the percentage of individuals with indicated GOLD status. (B) Patients with genotypes involving minor allele T showed lower FEV1 predicted values. (C) Patients with genotypes involving minor allele T showed lower FEV1/FVC ratio (Tiffeneau index). Bars represent standard deviation and the black triangle represents the mean value. Stars indicate statistically significant differences (p < 0.05).

