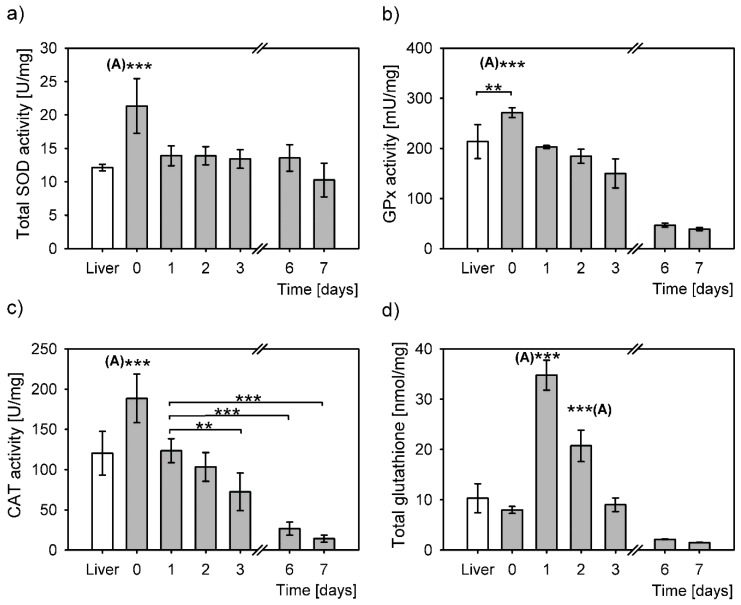
Figure 2.
Antioxidative response to oxidative stress in liver (white bars) and in primary hepatocytes at six different time points after cell isolation (grey bars). The values determined in liver and in primary hepatocytes were normalized to mg of total protein and expressed as means ± SD. Statistical significance is represented by “*” symbols (**: P < 0.01, ***: P < 0.001). “(A)”: significantly differs to all other time points/categories. (a) Superoxide dismutase activity (SOD). Overall statistically significant difference between the time points (one-way ANOVA, P = 4 × 10⁻⁶), however only SOD activity right after isolation (day 0) differs significantly to all the other time points (to liver: P = 9 × 10⁻⁵, day 1: P = 3 × 10⁻⁴, day 2: P = 2 × 10⁻⁴, day 3: P = 6 × 10⁻⁵, day 6: P = 2 × 10⁻⁴, day 7: P = 1 × 10⁻⁶, Bonferroni post hoc test). (b) Glutathione peroxidase activity (GPx). Overall statistically significant difference between the time points (one-way ANOVA, P = 3 × 10⁻¹³). Bonferroni post hoc test: significant differences between the day 0 cells and the following time points liver: P = 0.02, day 1: P < 10−18, day 2: P = 9 × 10⁻⁷, day 3: P = 1 × 10⁻⁸, day 6: P = 3 × 10⁻¹², day 7: P = 1 × 10⁻¹². (c) Catalase activity (CAT). The overall difference between the CAT activities in all samples (P = 5 × 10⁻¹⁴, one-way ANOVA). Bonferroni post hoc test: significant differences between day 0 and the following time points: liver: P = 4 × 10⁻⁵, day 1: P = 0.001, day 2: P = 2 × 10⁻⁶, day 3: P = 2 × 10⁻⁹, day 6: P = 3 × 10⁻¹³, day 7: P = 1 × 10⁻¹². CAT activity in hepatocytes of day 1 compared to day 3: P = 0.02, day 6: P = 1 × 10⁻⁶, day 7: P = 5 × 10⁻⁷, Bonferroni post hoc test. (d) Total glutathione concentration over days differs significantly (P = 1 × 10⁻¹⁸, one-way ANOVA). Day 1 to other time points: liver: P = 1 × 10⁻¹³, day 0: P = 1 × 10⁻¹⁶, day 2: P = 5 × 10⁻¹⁰, day 3: P = 2 × 10⁻¹⁶, day 6: P = 1 × 10⁻¹⁶, day 7: P = 7 × 10⁻¹⁷, Bonferroni post hoc test. Day 2 compared to: liver: P = 4 × 10⁻⁶, day 0: P = 2 × 10⁻⁹, day 3: P = 4 × 10⁻⁹, day 6: P = 3 × 10⁻¹¹, day 7: P = 2 × 10⁻¹¹, Bonferroni post hoc test.

