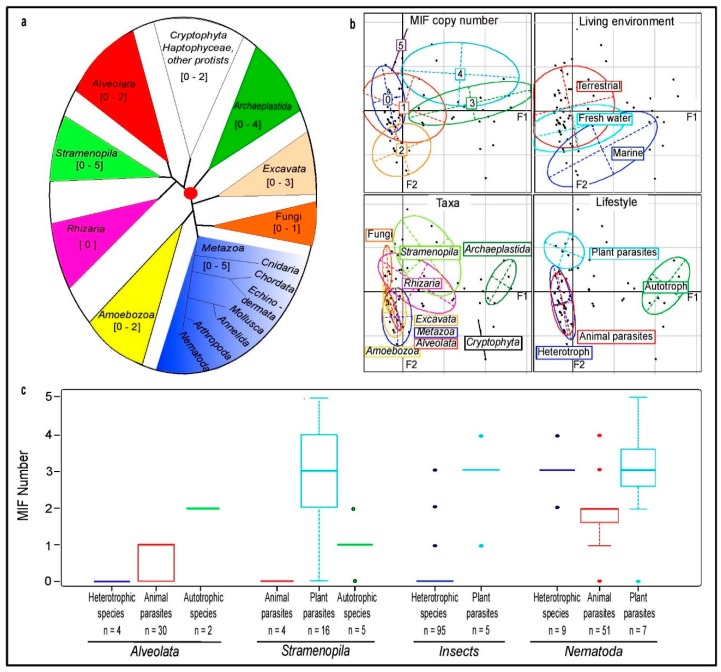
Figure 1.
Analysis of MIF distribution across eukaryotic kingdoms. (a) Rooted phylogenetic tree of eukaryotic kingdoms according to Burki et al., 2014. The size of the triangle areas representing collapsed clades is not proportional to the number of taxa within each clade. The range of MIF sequence number identified in the respective species is indicated within square brackets. (b) Graphical representation of Multiple Correspondence Analysis (MCA) data showing, respectively, the distribution of MIF number, the environment, major taxa, and lifestyle. The confidence ellipses delimitate the centroid around each variable. The adjusted inertia of the F1 and F2 axes are 52.54% and 15.64% respectively. (c) Box plot analysis of MIF number according to the species lifestyle in Alveolata and Stramenopila, insects and nematodes (n = number of species). The vertical axis corresponds to the number of unique MIF protein sequences per species. Each box is delimited by the quartiles Q1 and Q3, whose variation Q3–Q1 corresponds to 50% of the distribution. The horizontal line in the center of the box represents the median value. The two ends of the vertical bars correspond to the values of the first and last percentiles (C1 and C99) and delimitate 98% of the sample distribution. Extreme values (outliers) are indicated by a dot (below 2% of the sample distribution).

