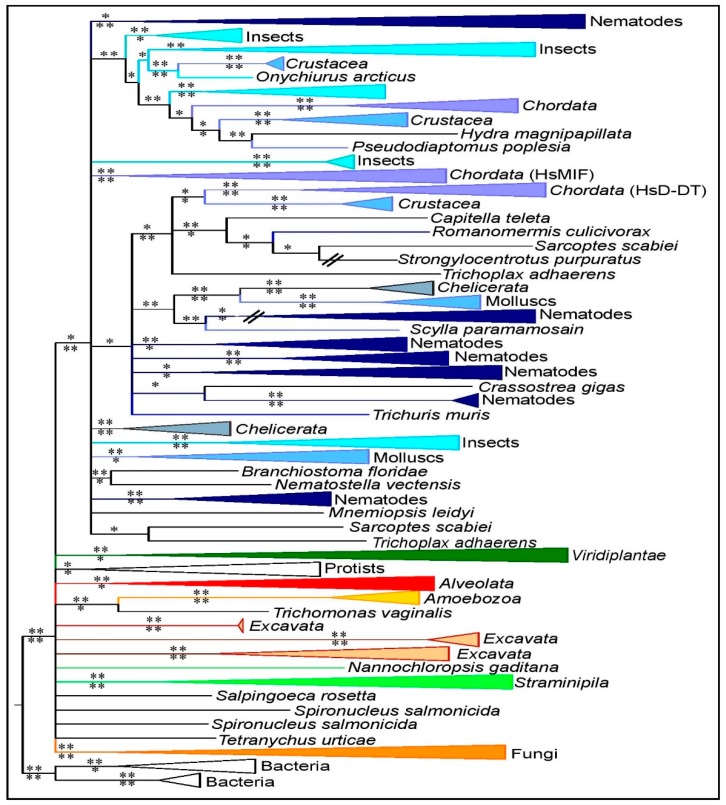
Figure 2.
Overview of MIF phylogeny across eukaryotic kingdoms. Phylogenetic analysis of 720 MIF sequences based on alignments of 113 amino acid characters using the Bayesian Inference (BI) method and rooted using bacterial sequences (see Materials and Methods for details). Posterior probability (PP) support values are indicated above the branch for the BI and corresponding approximate likelihood-ratio test (aLRT) support values below the branch for the ML analysis. *: PP > 0.5 or aLRT > 0.7. **: PP > 0.7 or aLRT > 0.9. MIF clusters are colored according to the taxonomic phyla: metazoa (shades of blue), Stramenopila (light green), Archaeplastida (dark green), Alveolata (red), fungi (dark orange), Excavata (light orange), Amoebozoa (yellow), Rhizaria (pink), and Cryptophyta–Haptophyceae–Picozoa (white). Color codes of phyla are identical for all figures of the study.

