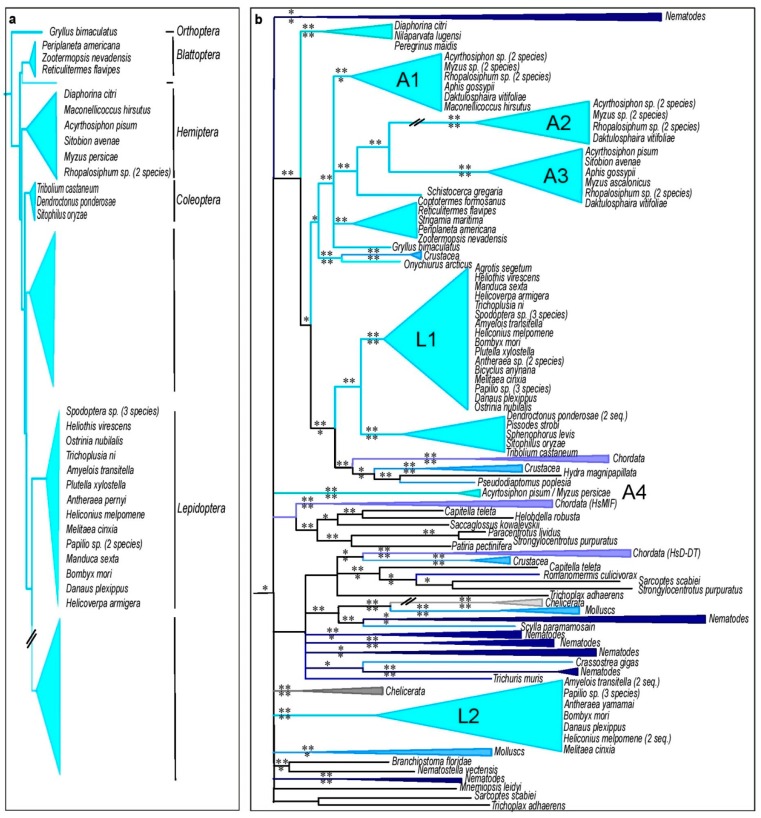
Figure 5.
Insect species tree and corresponding MIF phylogeny. (a) BI tree topology based on insect 18S rRNA sequences. (b) BI tree topology for MIF sequences of the same species. The symbol // indicates that the respective branch does not follow the scale of the figure. Species and orders (Diptera, Hymenoptera, and Phthiraptera) lacking MIF sequences appear in grey. Colors of MIF clusters correspond to the species from which the MIF sequence originated. PP support values are indicated above the branch for the BI and corresponding aLRT support values below the branch for the ML analysis. *: PP > 0.5 or aLRT > 0.7. **: PP > 0.7 or aLRT > 0.9. The corresponding tree using the ML method is presented in Supplementary Figure S5b.

