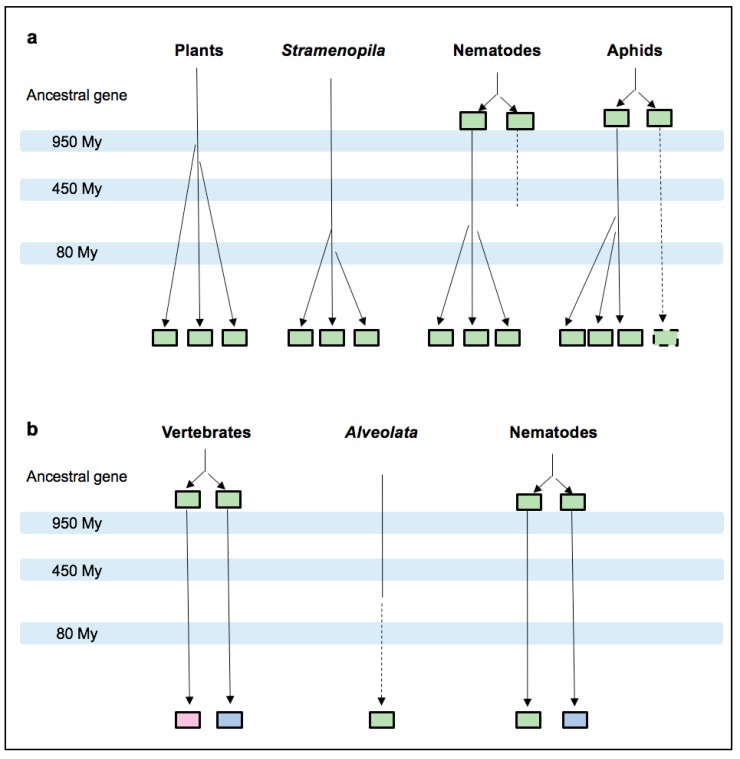
Figure 7.
Evolutionary model showing MIF duplication events in phyla from selected eukaryotic kingdoms. The hypothesized duplication events are indicated on simplified lineage trees reconciling the median MIF number analysis and MIF phylogeny, for plants and plant parasites belonging to protists or metazoans (a), and for vertebrate and vertebrate parasites belonging to protists or metazoans (b). Light green boxes represent MIF members that cannot be related to the chordate MIF or D-DT variants in our study. Light pink and light blue boxes represent sequences associated with the chordate MIF and D-DT, respectively. Dashed lines indicate the apparent loss of one MIF member. The approximate time scale is based on median estimate from TimeTree. For example, 950 MYA represents the period between 757 and 1147 MYA.

