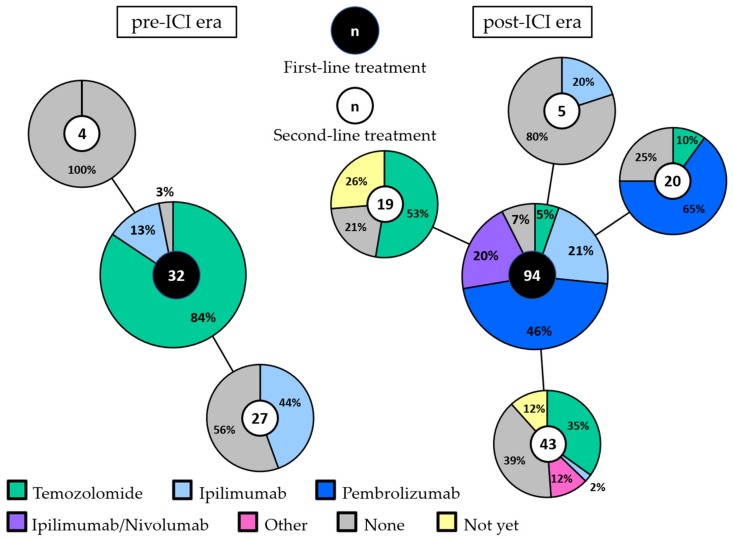
Figure 1.
First-line and second-line treatment in the pre-ICI and post-ICI era. The large pie charts represent the first-line treatment in the pre-ICI era (left) and the post-ICI era (right). Second-line treatment is shown per first-line treatment in the connected smaller pie charts. The total number of patients in each pie chart is depicted in the middle. Patients that are still alive, either with ongoing partial response or stable disease to first-line treatment or with progression but did not receive second-line treatment yet, are depicted in yellow (“not yet”). Abbreviations: ICI, immune checkpoint inhibitor.

