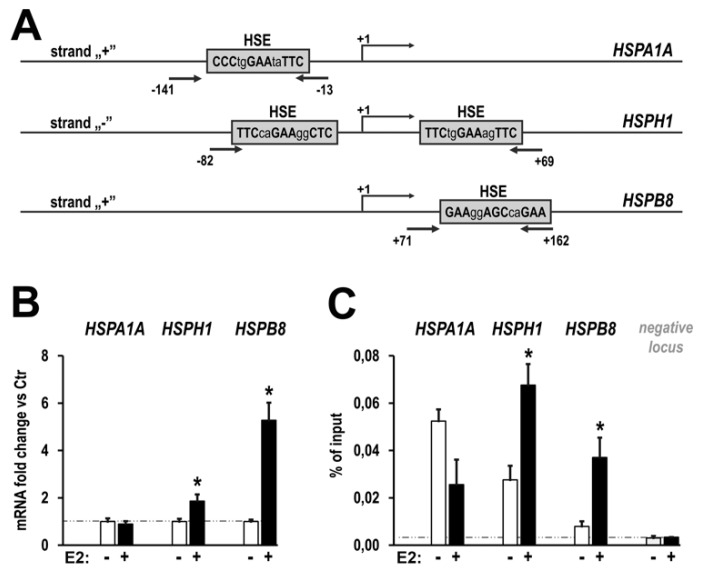
Figure 4.
E2-induced HSF1 is transcriptionally active. (A) The architecture of promoter regions of three selected HSP genes: location of the heat shock elements (HSEs) and regions amplified in ChIP-qPCR analysis (arrows) are marked. (B) qPCR analysis of mRNA levels of selected HSP genes in response to E2 (10 nM, four hours). (C) qPCR analysis of E2-induced (10nM, one hour) HSF1 binding to the known HSE sequences in promoter regions of selected genes and to the control region (negative locus). Asterisks indicate the statistical significance of differences (p < 0.05) between control and test samples.

