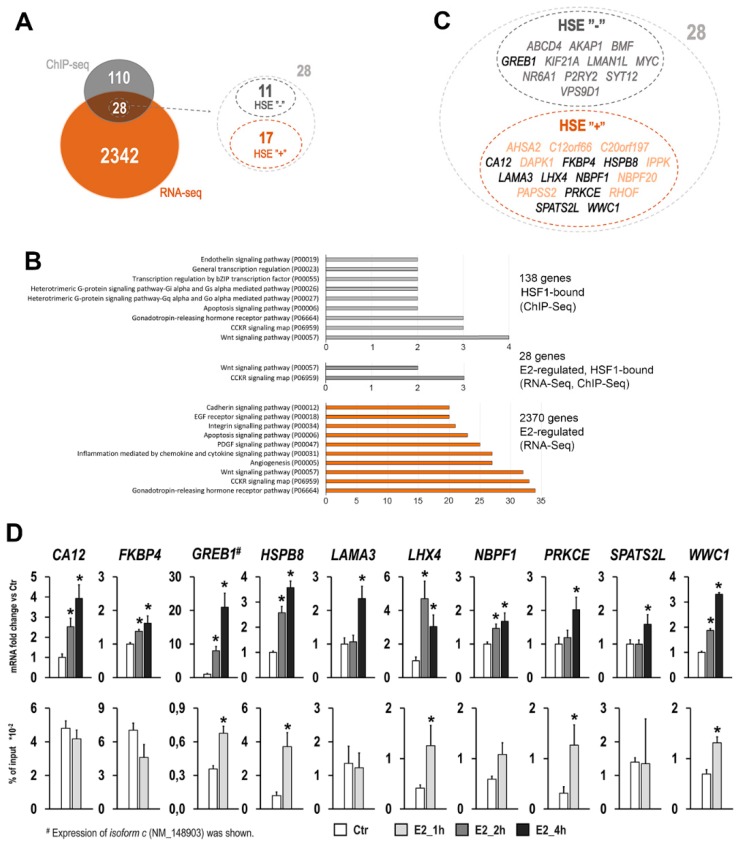
Figure 5.
Identification of genes affected by E2-treatment potentially regulated by HSF1 in MCF7 cells. (A) A number of genes with E2-induced binding of HSF1 in their regulatory region (identified by ChIP-Seq) and/or altered expression profile (identified by RNA-Seq). To find HSE motifs and to identify genes directly regulated by HSF1, the detailed analysis within the ChIP-Seq-detected peaks was performed. (B) Gene ontology analyses showing numbers of genes in pathways from the PANTHER classification system. In the case of gene sets selected in ChIP-Seq (138 or 28 genes), only pathways with more than two genes are shown. In the case of all E2-regulated genes, only ten pathways with the highest number of genes are shown. (C) List of 28 E2-regulated genes with and without HSE motifs in their regulatory regions. Bolded symbols indicate the genes selected for further validation experiments. (D) Validation analysis for ten selected genes. Gene expression (upper row) and binding of HSF1 to detected HSE sequences in regulatory regions (bottom row) were analyzed by qPCR. Asterisks indicate the statistical significance of differences (p < 0.05) between control and test samples.

