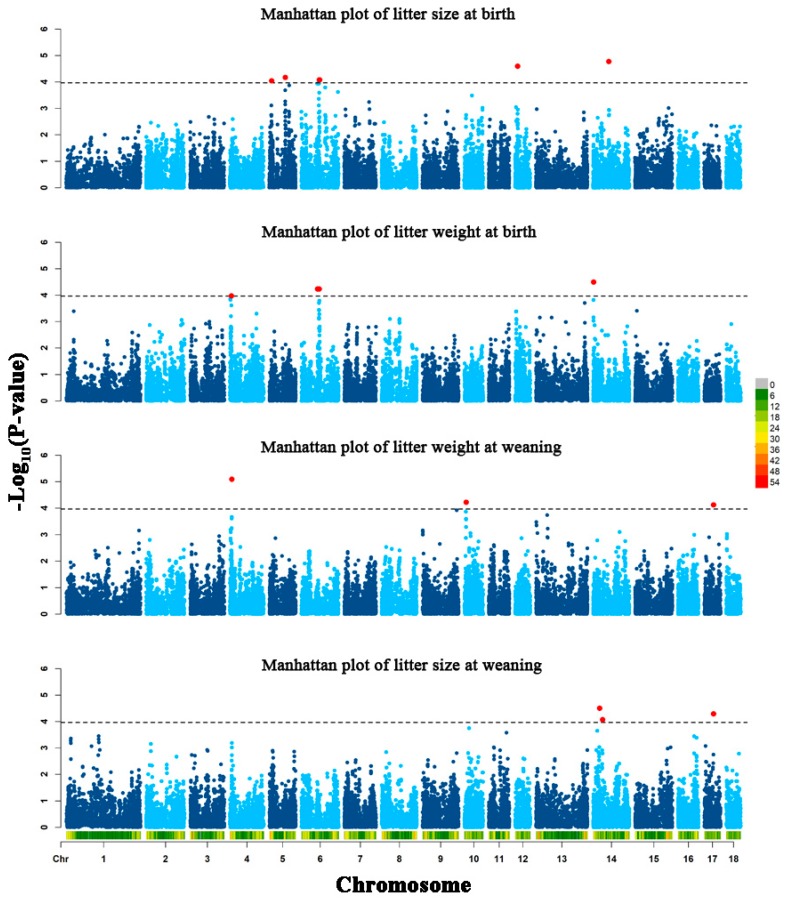
Figure 1.
The Manhattan plots of four porcine reproductive traits distinguished by text labels. The y-axis of the Manhattan plots display the -log10 (p-value) of each SNP in the genome-wide association analysis. The black horizontal lines divide SNP with p-values <1.08e–4. The red dots stand for the potential SNPs associated with the traits of LSB, LWB, LSW, and LWW.

