Figure 2.
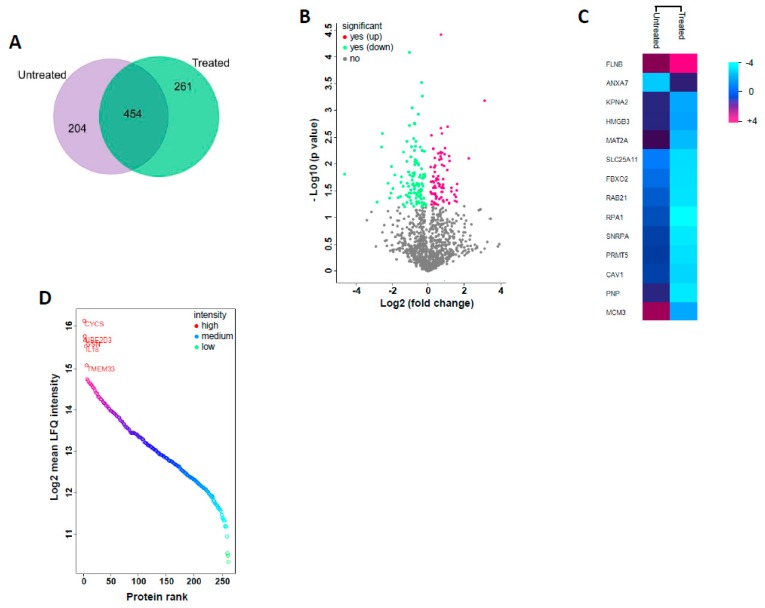
Proteomics data interpretation and visualization. (A) Venn diagram showing the unique proteins identified in untreated vs. guggulsterone treated samples and the overlapping proteins are the ones present in both. (B) Volcano plot comparing differential protein expression in untreated and GS treated samples. The proteins significantly upregulated are red dots and downregulated are green dots, while the grey dots represent the proteins with unaltered expression. The p-value < 0.05 was used for this significance cutoff. (C) Heatmap of the significantly dysregulated proteins after GS treatment with FDR (p-value) < 0.05 as significance threshold and fold-change >2 or <−1.5 as differential abundance threshold. (D) Dynamic range of quantified proteins uniquely present in GS treated sample. Distribution of expression intensities of quantified proteins show a large dynamic range of abundance with five proteins (CYCS, UBE2D3, GSN, IL8, and TMEM33) exclusively expressed with very high orders of magnitude.

