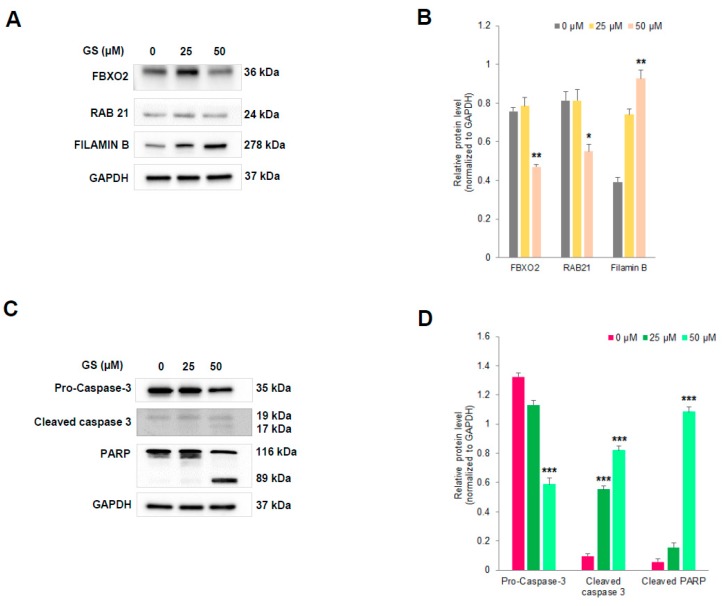
Figure 8.
Validation by western blot analysis. (A,C) HCT 116 cells were treated with increasing doses of GS (as indicated) for 48 h and cells were lysed for western blot analysis with the antibodies FBXO2, RAB21, Filamin B, pro-caspase-3, cleaved caspase 3, and PARP. GAPDH served as the loading control. (B,D) Relative protein levels quantified by densitometry analysis. * p < 0.03, ** p < 0.002, *** p < 0.0001.

