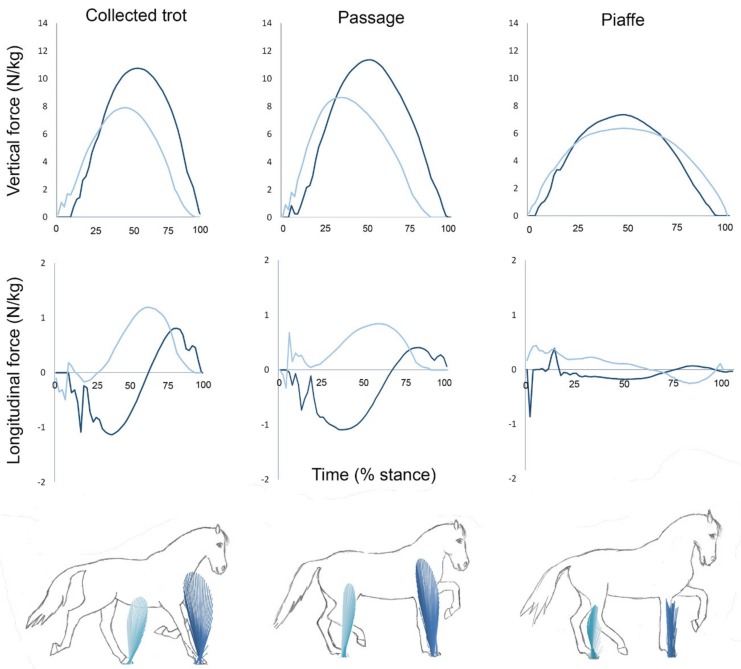
Figure 4.
Vertical (top row) and longitudinal (middle row) ground reaction forces for one horse performing collected trot (left), passage (middle) and piaffe (right). The scale on the y axis is the same for graphs depicting the same force component. The x axis is scaled to the percentage of stance phase but the absolute length is proportional to the absolute stance duration for each gait. Dark lines: forelimb forces; light lines: hind limb forces. The force vector diagrams (bottom row) illustrate successive sagittal plane ground reaction force vectors for the fore and hind limbs in each gait.

