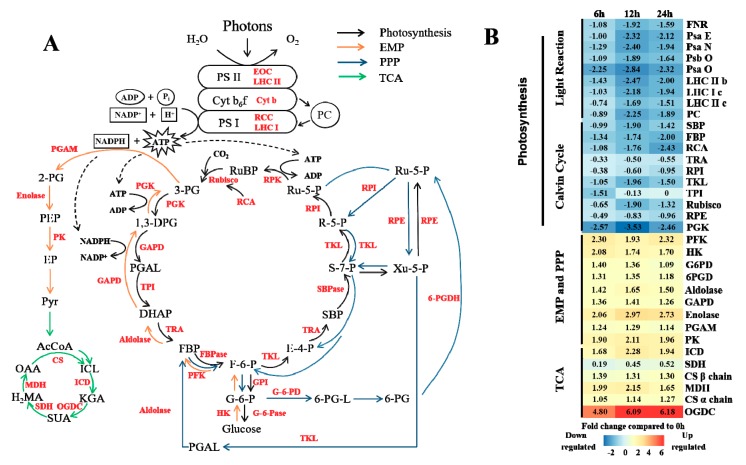
Figure 2.
Influence of high CO2 concentration on energy metabolism. (A) The main energy pathways in plants. Black, orange, blue and green arrows represent photosynthesis, the Embden-Meyerhof-Parnas (EMP) pathway, the pentose phosphate (PPP) pathway and the tricarboxylic acid (TCA) cycle, respectively. The different enzymes are shown in red font. (B) Expression changes in the genes involved in metabolic pathways in response to stress. White indicates no change, red up-regulation, and blue down-regulation in each treatment, as shown in the color bar for a log2 fold change scale. The abbreviations in the figure are shown in Table A2 from Appendix A.

