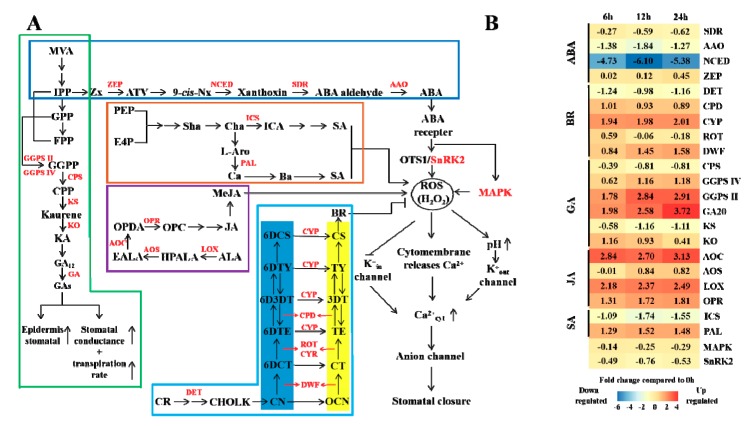
Figure 4.
Influence of high CO2 concentration on hormone and stomatal regulation. (A) The hormone biosynthesis pathways and stomatal regulation mechanism according to Zhao [35]. The mazarine, green, brown, purple and wathet frame represents ABA, GA, SA, JA and BR synthetic pathways, respectively. The blue and yellow block represents advanced and early C-6 oxidation pathway in BR biosynthesis, respectively. The different enzymes are shown in red font. Sharp and T-shaped arrows indicate positive and negative regulation, respectively. (B) Expression changes in the genes involved in metabolic pathways in response to stress. White indicates no change, red up-regulation, and blue down-regulation in each treatment, as shown in the color bar for a log2 fold change scale. The abbreviations in the figure are shown in Table A2 from Appendix A.

