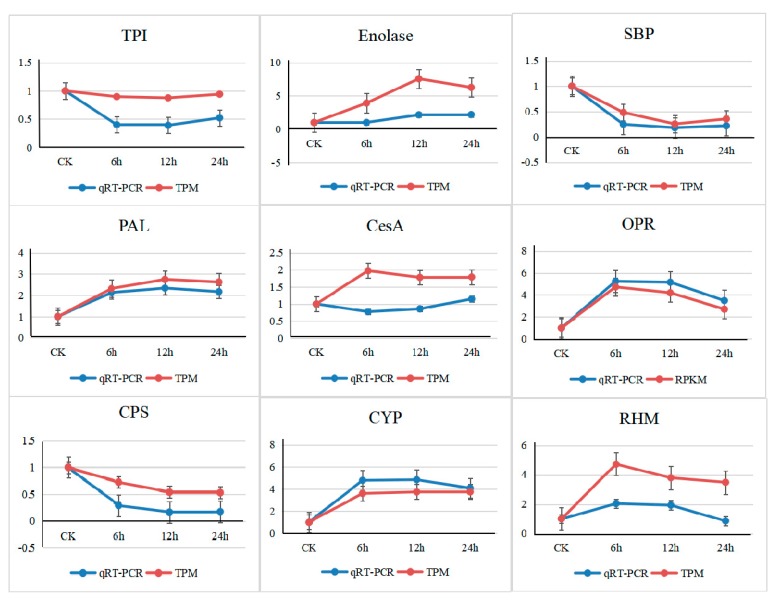
Figure 5.
The expression changes in the 9 randomly selected genes were determined using quantitative real-time PCR (qRT-PCR) results and sequencing data. The x-axis represents different processing times, and the y-axis represents changes in gene expression under CO2 stress. The data show the fold change in the expression of each gene under high CO2 relative to control conditions. Error bars represent standard deviations. Red indicates the RNA-sequencing results under the TPM (transcripts per million reads) algorithm, and blue indicates the qRT-PCR results.

