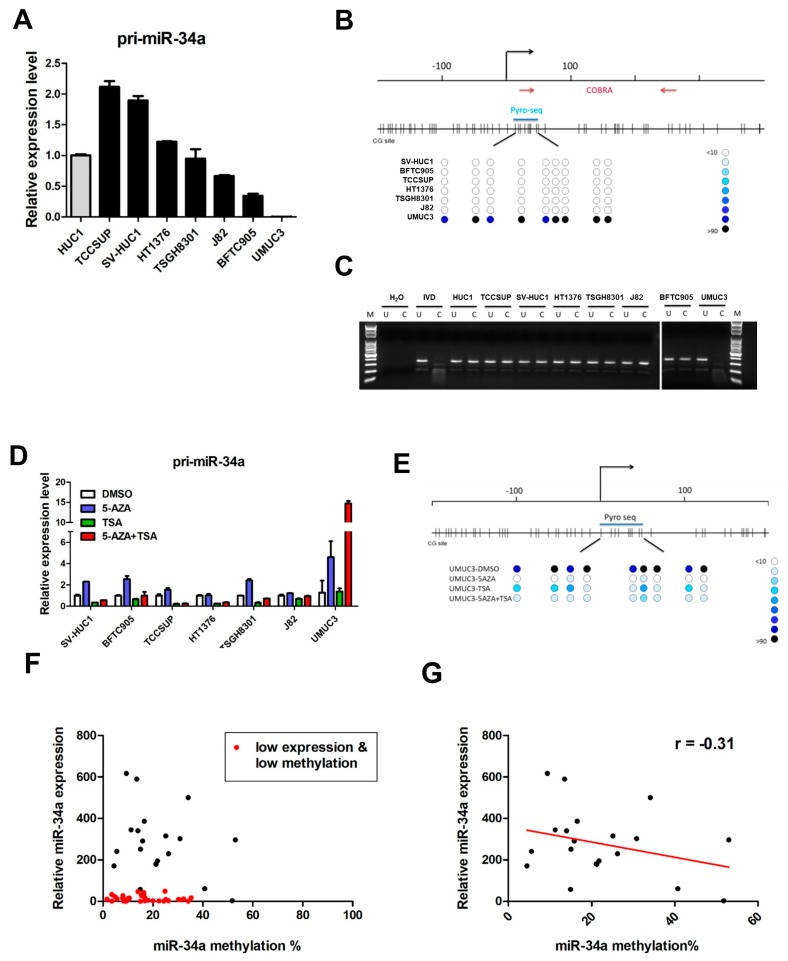
Figure 1.
miR-34a is epigenetically silenced by promoter DNA methylation in UMUC3 cell lines, and a subset of urothelial carcinoma (UC) patient samples. (A) Expression of pri-miR-34a in normal HUC1 bladder cells and various UC cell lines, relative to GAPDH, as an internal control. Methylation analysis of the miR-34a promoter in various UC cell lines, using (B) bisulphite pyrosequencing and (C) COBRA assay. The upper panel in (B) presents the genomic structure of the miR-34a promoter, with the corresponding locations of all CpG sites from −200 to +400. The lower panel in (B) illustrates DNA methylation at each CpG site (circle) of various cells, where the intensity of the blue color indicates the degree of methylation. The CpG sites interrogated by bisulphite prosequencing are also indicated. In the COBRA assays in (C), bisulphite-modified DNA was amplified via PCR and digested using BstUI. U, undigested control; C, digested using BstUI; M, DNA ladder marker; IVD, in vitro methylated DNA. (D) Expression of pri-miR-34a in UC cell lines, following epigenetic treatment. UC cell lines treated with 5-aza-2’-deoxycytidine (5aza) and/or trichostatin A (TSA) were examined for pri-miR-34a expression, using qRT-PCR. Error bars represent standard deviations calculated from duplicates. (E) Bisulphite pyrosequencing analysis of the miR-34a promoter in UMUC3 cells treated with various epigenetic drugs, as in (D). (F) Scatter plot showing expression and promoter methylation of miR-34a in 55 urothelial carcinoma patient samples, showing a distinct group of patient samples (red dots) with both low expression and low promoter methylation of miR-34a. Analysis of the other patient samples (methylated) showed an inverse correlation (r = −0.31) between expression and methylation of miR-34a, as shown in (G).

