Figure 6.
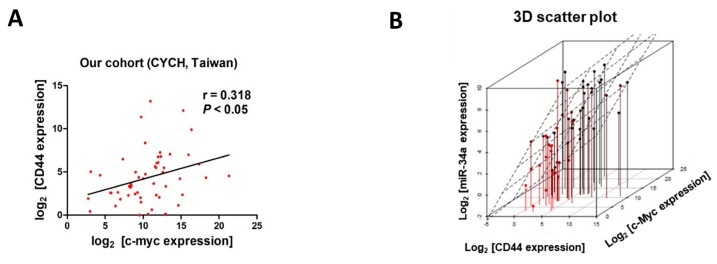
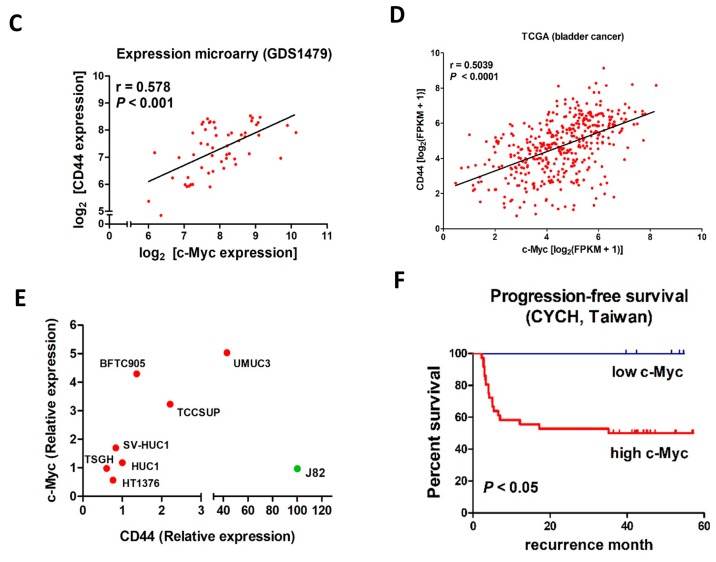
Positive correlation between c-Myc and CD44 expression in samples from urothelial carcinoma patients. (A) Scatter plot analysis revealed a positive association between the expression of c-Myc and CD44 (r = 0.318, p < 0.05) in samples obtained from 55 UC cancer patients at Chia-Yi Christian Hospital (CYCH), Taiwan. (B) 3D scatter plot showing positive correlations between c-Myc, CD44, and miR-34a in this cohort of UC patient samples. A positive correlation between the expression of c-Myc and CD44 was also observed in samples obtained from two publicly available databases (C) GEO GDS1479 (60 samples, expression microarray, r = 0.578, p < 0.05) and (D) TCGA (411 samples, RNA-Seq, r = 0.5039, p < 0.001). (E) Scatter plot showing the expression CD44 in UC cell lines. Except for J82 cells (green dot), which showed an exceptionally low expression of c-Myc, all other cells showed a positive correlation between expression of these genes (r = 0.672). (F) Kaplan–Meier survival analysis indicating that higher c-Myc expression associates with poor recurrence-free survival (p < 0.05).


