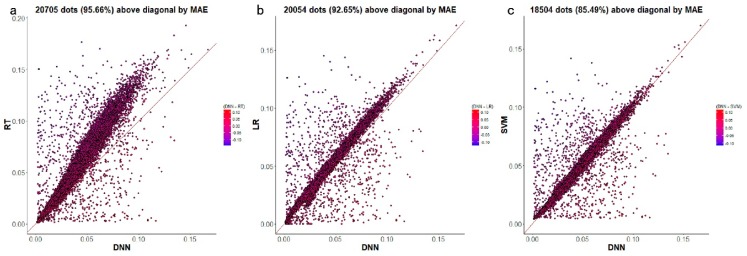
Figure 5.
The predictive MAE of each target gene by D-GPM compared with RT, LR, and SVM for MBV-te. Each dot represents one of the 21,645 target genes. The x-axis is the MAE of each target gene obtained by D-GPM, and the y-axis is the MAE of each target gene obtained by the other machine learning method. The dots above the diagonal indicate that D-GPM achieves lower MAE compared with the other method. (a) D-GPM versus RT. (b) D-GPM versus LR. (c) D-GPM versus SVM.

