Figure 2.
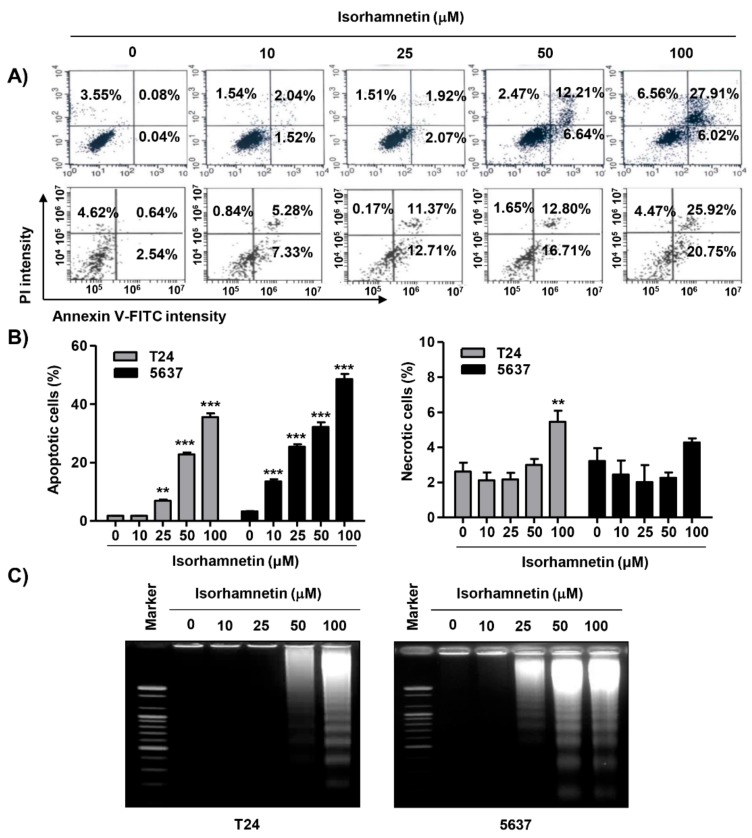
Induction of apoptosis using isorhamnetin in bladder cancer cells. (A,B) After treatment with different concentrations of isorhamnetin for 48 h, the cells were fixed and stained with annexin V-fluorescein isothiocyanate (FITC) and PI for flow cytometry analysis. (A) Representative profiles. The results show early apoptosis, defined as annexin V+ and PI− cells (lower right quadrant), and late apoptosis, defined as annexin V+ and PI+ (upper right quadrant) cells. (B) The percentages of apoptotic cells (left) and necrotic cells (right) were determined by expressing the numbers of Annexin V+ cells as percentages of all the present cells. The results are presented as the mean ± SD of three independent experiments (** p < 0.001 and *** p < 0.0001 compared to the control). (C) DNA fragmentation in the cells cultured under the same conditions was analyzed via the extraction of genomic DNA, electrophoresis in agarose gel, and then visualization using ethidium bromide (EtBr) staining.

