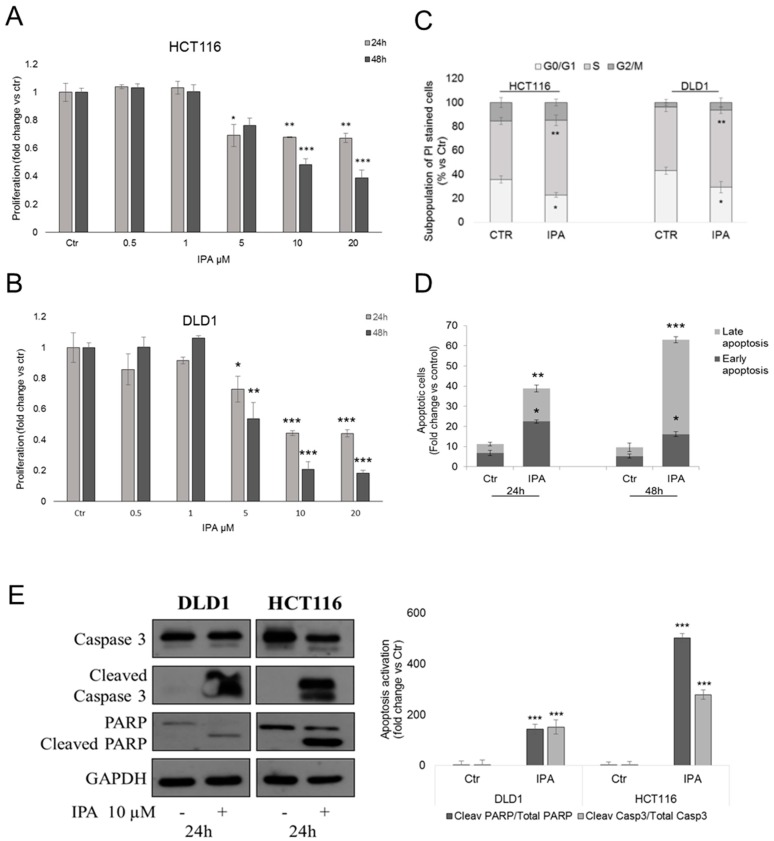
Figure 1.
Effect of IPA on CRC cells in vitro. BrdU incorporation assay in HCT116 (A) and DLD1 (B) cells treated with indicated concentrations of IPA, for 24 h or 48 h. (C) Cell cycle analysis of HCT116 and DLD1 cells treated with IPA for 24 h and stained with PI. (D) Cytofluorimetric apoptosis analysis of Annexin V-FITC/PI double-stained DLD1 cells treated with 10 µM IPA, for 24 h and 48 h. Data are expressed as mean ± standard deviation (SD) of five independent experiments in triplicate. * p < 0.05, ** p < 0.01, *** p < 0.005 versus (vs.) control. (E) Representative western blot and densitometry analysis of apoptotic pathway activation in DLD1 and HCT116 cells. GAPDH was used as loading control. Data are expressed as mean ± SD of three independent experiments. *** p < 0.005 vs. control.

