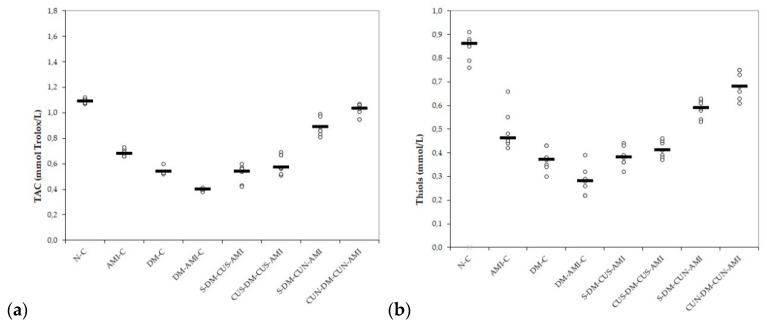
Figure 3.
Variation by groups of serum antioxidant capacity: (a) TAC (total antioxidant capacity) and (b) thiols by groups. Notes: The circles represent the individual values, and the horizontal line is given by the median. Abbreviations: N = normal; C = control; AMI = acute myocardial infarction; DM = diabetes mellitus; S = saline; CUS = curcumin solution in a dose of 200 mg/kg bw; CUN200 = curcumin nanoparticles solution in a dose of 200 mg/kg bw.

