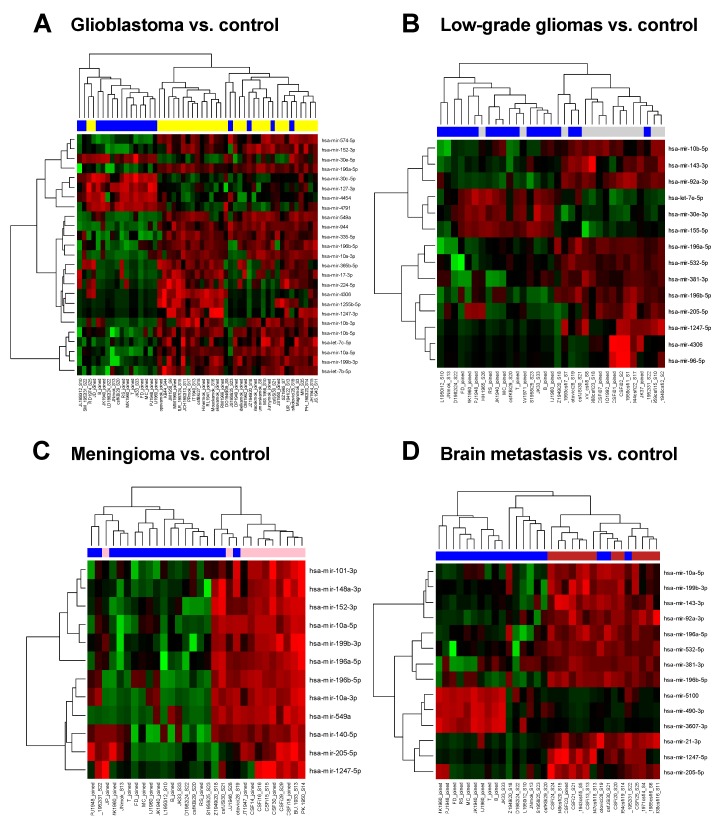
Figure 1.
Hierarchical clustering based on cerebrospinal fluid (CSF) miRNA expression profiles of glioblastomas and controls (A); low-grade gliomas and controls; (B) meningiomas and controls (C); and brain metastases and controls (D). Blue color always indicates CSF specimen collected from control individual. A gradient of green and red colors is used in the heatmap (green color indicates lower expression whereas red color indicates higher expression of individual miRNAs in analyzed samples).

