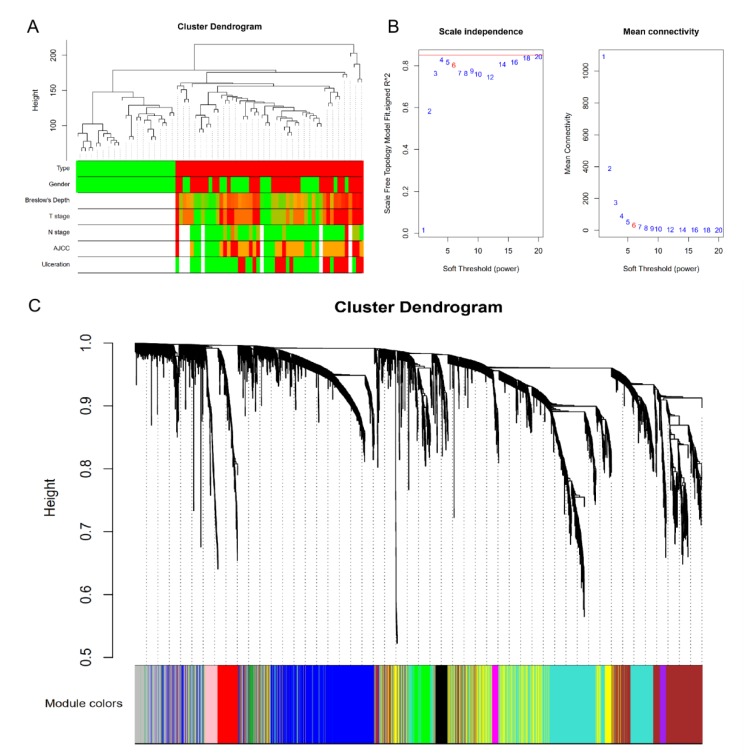
Figure 2.
Gene co-expression network and modules. (A) Clustering dendrogram of 78 samples. (B) Determination of soft-thresholding power in the weighted gene co-expression network analysis (WGCNA). When β = 6, R2 > 0.8 and mean connectivity < 100, indicating that the network has the characteristics of scale-free topology. (C) Dendrogram of all differentially expressed genes clustered based on a dissimilarity measure. The cluster analysis result is shown above, and module identification is shown below.

