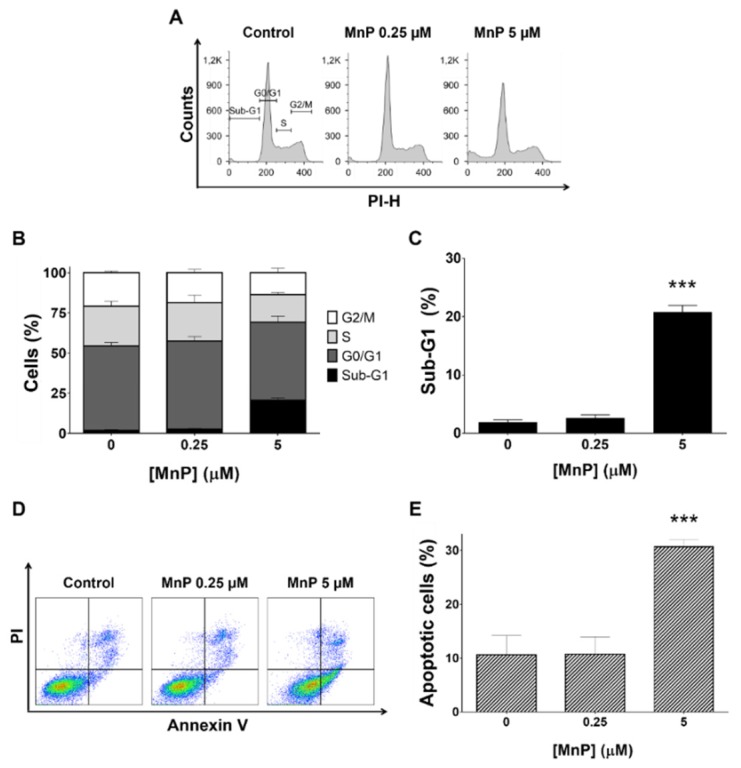
Figure 3.
Effect of manganese porphyrin (MnP) on the cell cycle progression of 786-O cells. Cellular DNA content was analyzed by flow cytometry after 24 h incubation with MnP. (A) representative flow cytometry histograms. (B) sub-G1, G0/G1, S, and G2/M populations summary results. (C) sub-G1 population percentage. Percentage of apoptotic cells determined by PI and Annexin V staining (D,E) with representative flow cytometry dot-plots (D) and summary results show the percentage of apoptotic cells (E). Values represent mean ± SD (n = 3), *** p < 0.001 (Student’s t-test).

