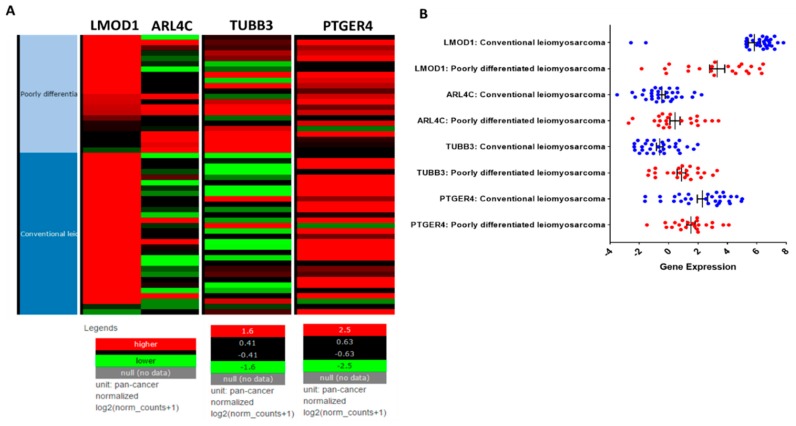
Figure 2.
Gene expression analysis of leiomyosarcoma (LMS) from the TCGA. (A) Gene expression heat map for LMOD1, ARL4C, TUBB3, and PTGER4 from conventional (dark blue) or poorly differentiated (light blue) leiomyosarcoma obtained from the cancer genome atlas (TCGA). Red indicates higher gene expression and green lower gene expression. Samples were restricted to female patients with LMS from gynecologic and retroperitoneal areas (n = 54). LMOD1 and ARL4C are biomarkers for conventional and poorly differentiated subtypes, respectively. (B) Mean gene expression for LMOD1, ARL4C, TUBB3, and PTGER4 segregated by LMS subtype. Gene expression for conventional LMS indicated in blue and for poorly differentiated LMS in red. Heat map image was modified from the Xena Browser [31].

