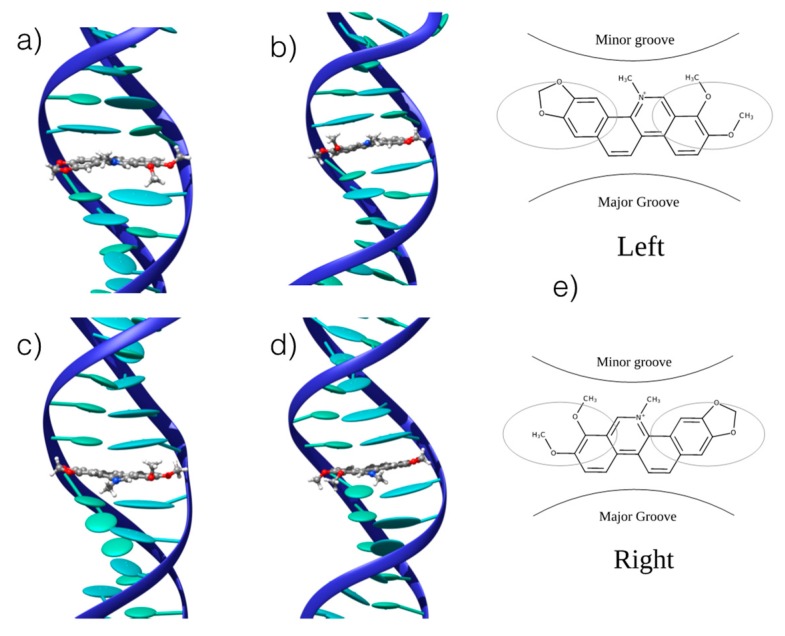
Figure 3.
Representative snapshots of the stable interaction modes between CHE and B-DNA: (a) he-AT left orientation; (b) he-AT right orientation; (c) ho-AT left orientation; (d) ho-AT right orientation. (e) Schematic representation of the of the two competitive left and right interaction modes. The ellipsoids represent the π-stacked nucleobases. CG strands give similar structures that are reported in the Supplementary Information.

