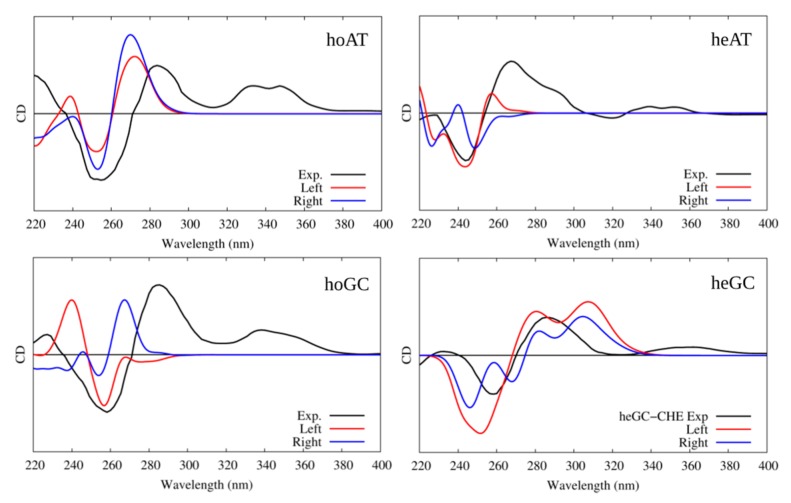
Figure 4.
Experimental and simulated electronic circular dichroism (ECD) spectra of CHE in the presence of B-DNA; intensities are reported in arbitrary units. The black line represents the experimental spectrum uniformly scaled to match the values of the convoluted one. The red line represents the simulated spectrum for CHE in the left orientation, while the blue one represents the simulated ECD of CHE in the right orientation. Note that the CHE absorption contribution was not considered in the calculated spectra.

