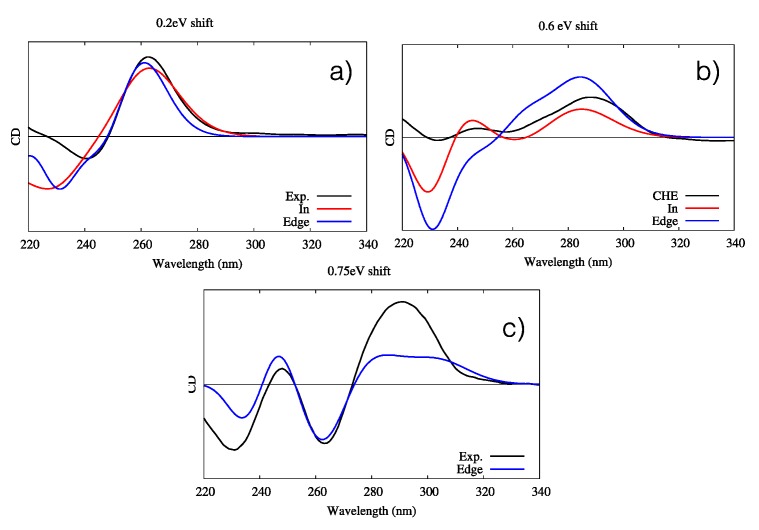
Figure 6.
Experimental and simulated ECD spectra of the three G4–CHE complexes. Intensities are given in arbitrary units. (a) Parallel conformation, including the experimental (black line) and simulated “in” (red line) and “edge” (blue line) orientations; a shift of 0.2 eV has been applied. (b) Hybrid conformation, including the experimental (black line) and simulated “in” (red line) and “edge” (blue line) orientations; a shift of 0.6 eV has been applied. (c) Antiparallel conformation, including the experimental (black line) and simulated “edge” orientations (blue line); a shift of 0.75 eV has been applied. Note that for the simulated spectra, all stable interaction modes for each G4 conformer have been considered. The quantum mechanics (QM) partition was specifically designed to consider the DNA contribution only; hence, the CHE signal is not considered in the simulated spectra.

