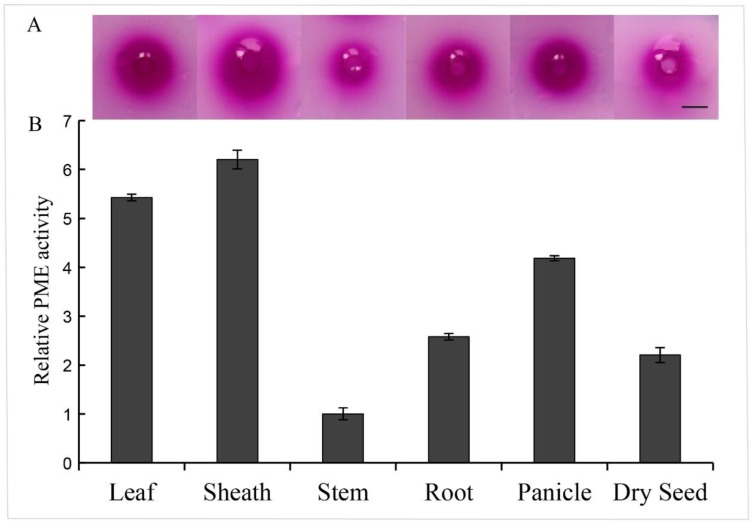
Figure 1.
Relative pectin methylesterase (PME) activity analysis of six sorghum tissues. Total protein was extracted from six tissues of sorghum to analyze the PME activity. (A) Stained gels of the PME reaction using ruthenium red, the red halo means the de-methylesterificated pectin by PME. Scale bar = 0.5 cm. (B) The relative PME activity with the tissue stem area set to one, based on the halo area of stained gel.

