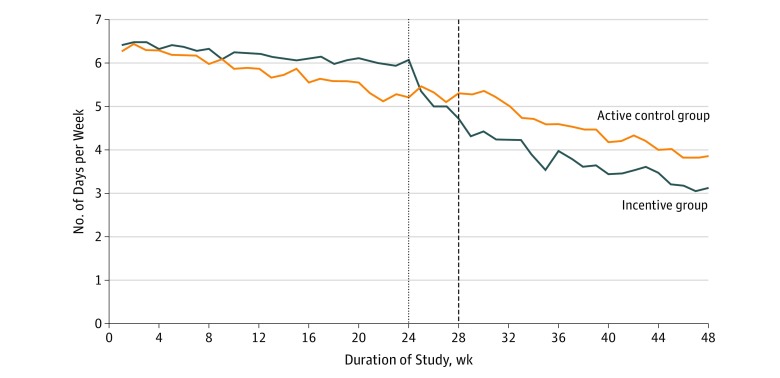
Figure 3. Mean Self-weighing Frequency .
Self-weighing frequency was measured as mean number of days per week that self-weighing was performed by group over time. Week 0 indicates randomization. Self-weighing frequency in the incentive group (n = 128) declined more slowly than in the active control group (n = 130) during weeks 0 to 24 (difference, 0.03 times/wk; 95% CI, 0.01-0.05 times/wk; Wald test, P = .002) with similar declines in the 2 groups during weeks 28 to 48 after a transition period during which incentives ceased in the incentive group.

