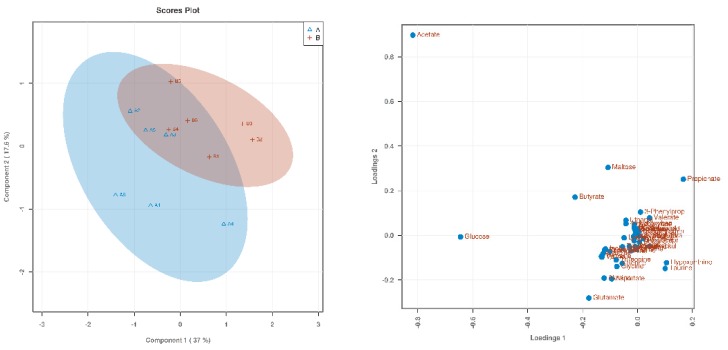
Figure 1.
The score plot and loading plot of THR85 and THR100 from the partial least squares discrimination analysis (PLS-DA) analysis. In the above PLS-DA score chart, different groups are represented by different colors. The degree of dispersion can reflect the reproducibility of the samples and the similarity of the metabolic profiles among the sample groups. The comparison group tended to separate from each other, but the trend was not significant.

