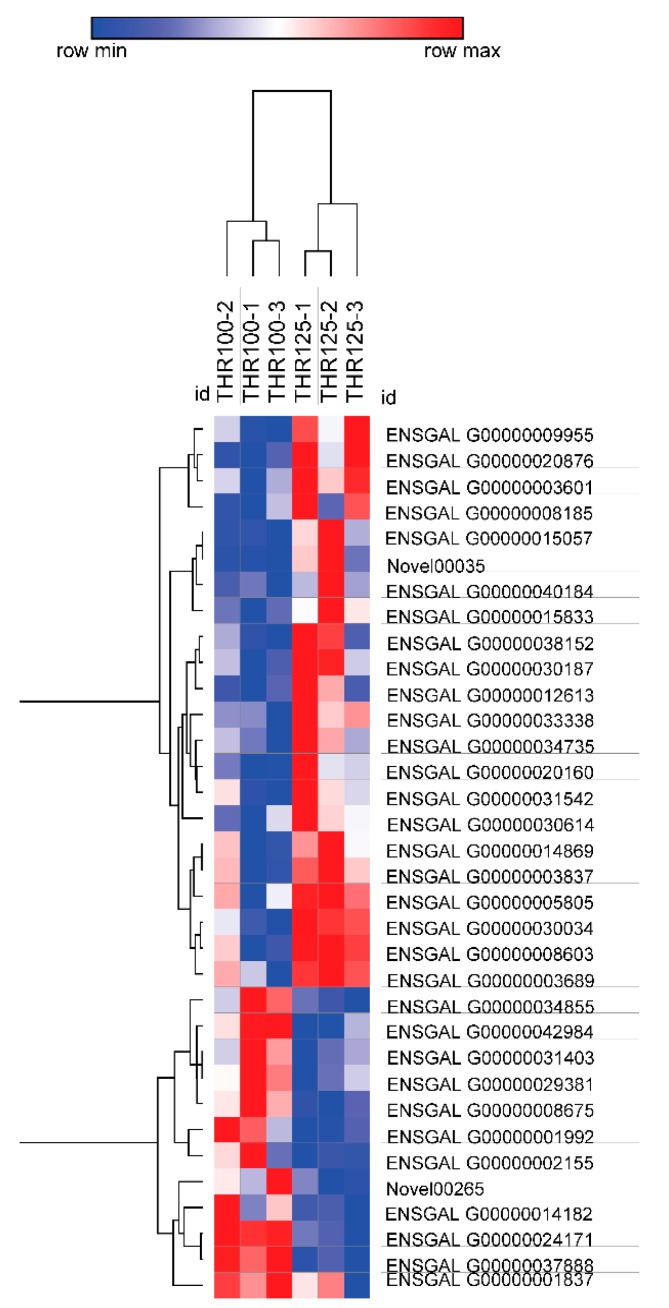
Figure 5.
Expression profiles of differential genes between THR100 and THR125. The heat map showed the differential gene expression profiles in THR100 and THR125 groups. Each row represents the level of expression of each differentially expressed gene; each column represents a biological repetition. The expression level of each gene is expressed by fragments per kilobase of exon per million reads mapped (FPKM) value. The FPKM value for each differential gene was used for plotting. Red indicates that the gene is highly expressed, and blue indicates a low expression level.

