Figure 1.
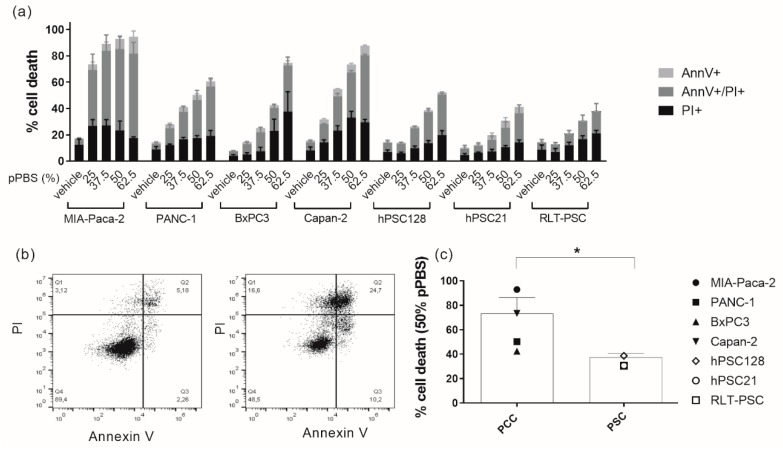
Sensitivity of pancreatic cancer cell (PCC) lines and pancreatic stellate cell (PSC) lines to different doses of plasma-treated phosphate-buffered saline (pPBS) treatment. (a) Percentage of cytotoxicity 48 h post pPBS treatment in four different PCC lines (MIA-Paca-2, PANC-1, BxPC3, Capan-2) and three different PSC lines (hPSC128, hPSC21, RLT-PSC). Subdivisions in the percentage Annexin V+, PI+, and double positive cytotoxic cells are made. (b) Dot plots showing the flow cytometric analysis of Annexin V and PI staining after 25% pPBS treatment in MIA-Paca-2 (right) compared with the untreated control (left): Q1 = AnnV−/PI+; Q2 = AnnV+/PI+; Q3 = AnnV−/PI−; Q4 = AnnV+/PI−. Representative dot plots for all other cell lines are presented in Supplemental Figures S1 and S2. (c) The difference in sensitivity after 48 h of 50% pPBS treatment for means of all PCC lines and all PSC lines. Graphs represent mean ± SEM of ≥3 independent experiments. * p < 0.05.

