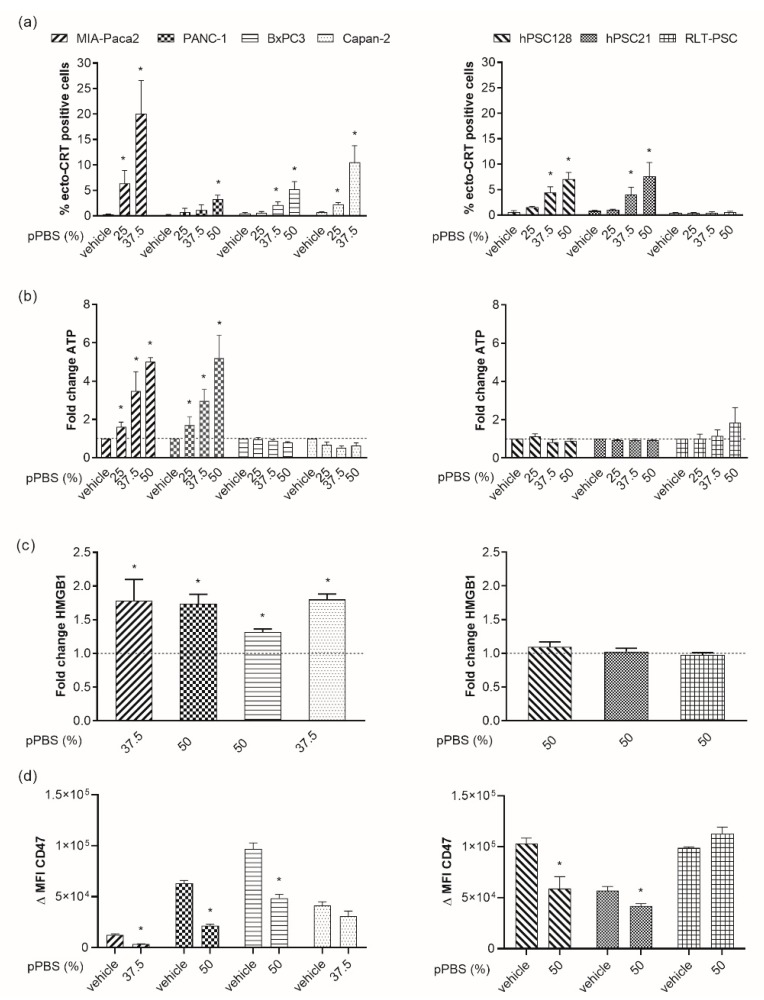
Figure 2.
Release of immunogenic cell death (ICD) markers after pPBS treatment. (a) Percentage of surface-exposed calreticulin (ecto-CRT) positive cells after increasing the dose of pPBS treatment (25%, 37.5%, 50% pPBS). (b) Adenosine triphosphate (ATP) secretion 4 h post treatment in the supernatant. (c) High-mobility group box 1 (HMGB1) secretion 48 h post pPBS treatment in supernatant. These data demonstrate the fold change of ATP secretion (ng/mL range) against the untreated control. (d) Difference in mean fluorescence intensity (ΔMFI) of CD47 after 48 h of pPBS treatment. ΔMFI represents [(MFI staining treated–MFI isotype treated)–(MFI staining untreated–MFI isotype untreated)]. Different concentrations of pPBS treatment are used (25%, 37.5%, 50% pPBS). In the left graphs, four different PCC lines are represented (MIA-Paca-2, PANC-1, BxPC3, Capan-2), and in the right graphs, three different PSC lines are represented (hPSC128, hPSC21, RLT-PSC). Graphs represent mean ± SEM of ≥ 3 independent experiments. * p < 0.05 significant difference compared with untreated conditions.

