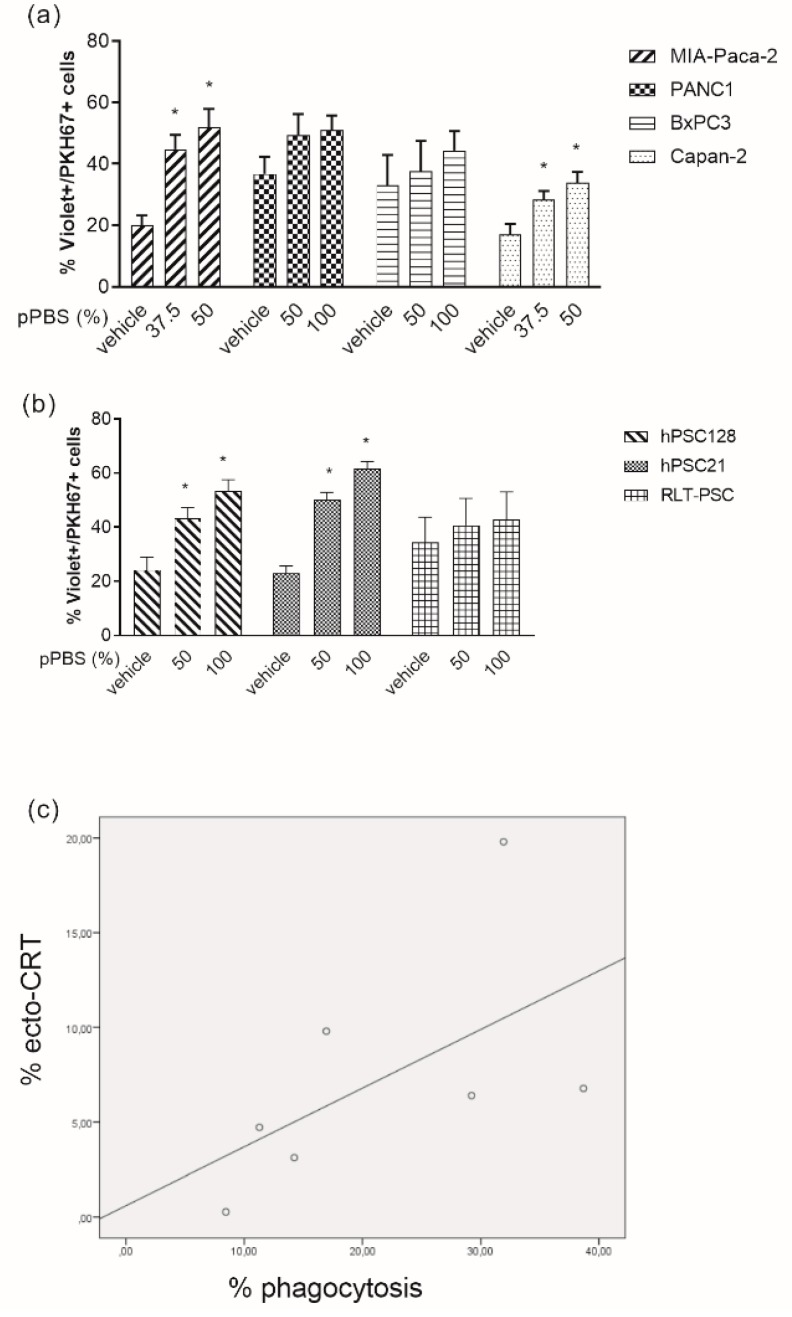
Figure 3.
Phagocytosis of pPBS-treated PCCs and PSCs by immature dendritic cells (DCs). (a) Percentage of phagocytosis of four different PCC lines (MIA-Paca-2, PANC-1, BxPC3, Capan-2) and (b) three different PSC lines (hPSC128, hPSC21, RLT-PSC), with increasing dosage of pPBS treatment. Phagocytosis of PKH67+ tumor cells by violet-labeled DC is expressed as the %PKH67+violet+ cells within the violet+ DC population. (c) Correlation between exposure of ecto-CRT and phagocytotic capacity of DCs in the seven cell lines (R = 0.786, p = 0.036). Graphs represent mean ± SEM of ≥3 independent experiments. * p < 0.05 significant differences compared with untreated control.

