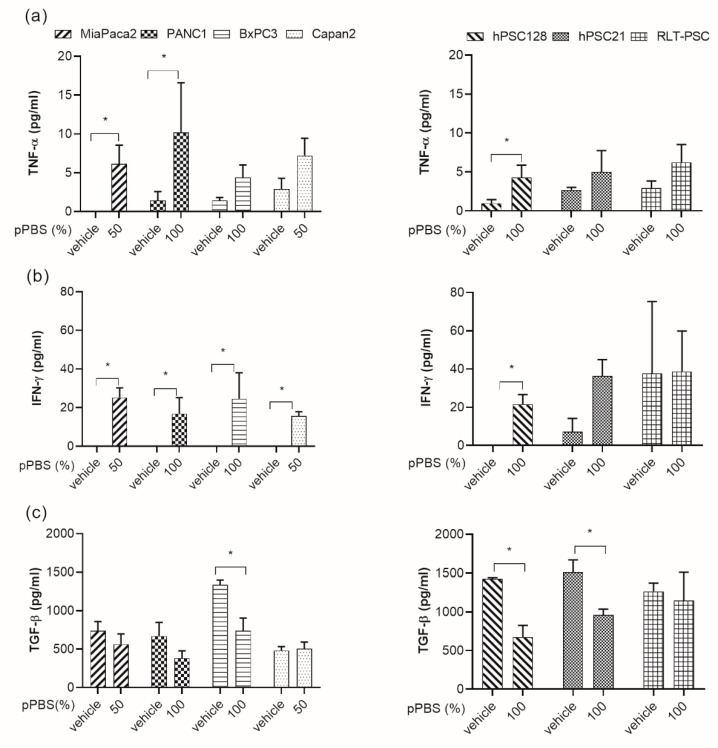
Figure 5.
Cytokine profile released by DCs in coculture with pPBS-treated PCCs and PSCs. Graphs show the concentration of TNF-α (a), IFN-γ (b), and TGF-β (c) released in coculture of DCs with pPBS-treated PCCs (left) and PSCs (right) after 48 h. Graphs represent mean of ± SEM of ≥3 independent experiments with different donors. * p < 0.05 significant differences compared with untreated control.

