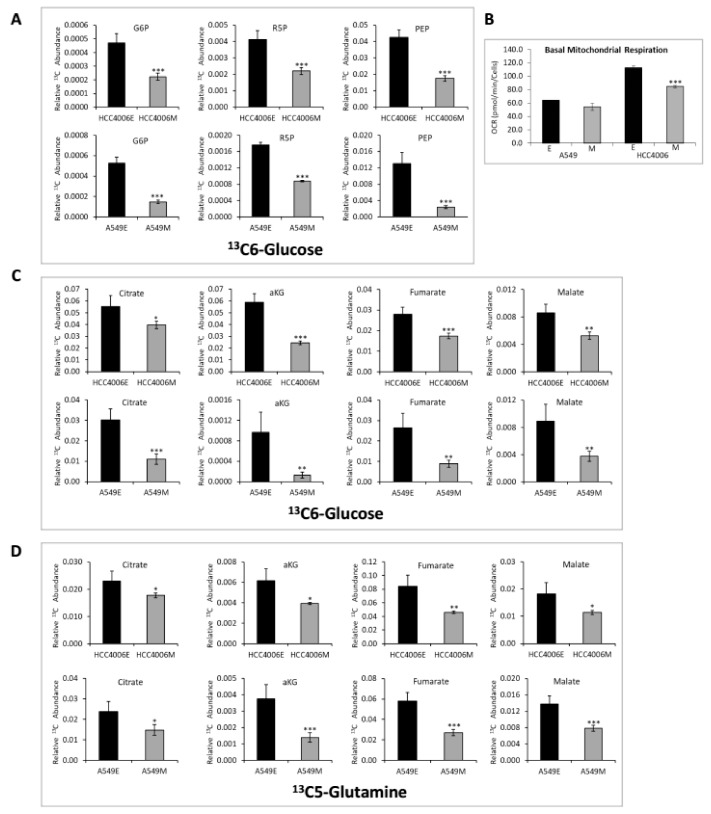
Figure 2.
Reduced glycolytic and TCA cycle activity in the mesenchymal cell states. (A) In A549 and HCC4006 E and M state cells treated with 13C glucose, there is a decrease in glucose labeled glycolytic and pentose phosphate pathway metabolites in the M state. (p < 0.05 *; p < 0.01 **; p < 0.001 ***). (B) In A549 and HCC4006, basal mitochondrial respiration is reduced in M state cells. (C) In A549 and HCC4006 M state cells treated with 13C6-glucose, there is a decrease in glucose labeled TCA cycle metabolites. (D) In A549 and HCC4006 M state cells treated with 13C5-glutamine, there is a decrease in glutamine labeled TCA cycle metabolites. Isotopologue distributions for 13C6-glucose are shown in Supplementary Figure S2.

