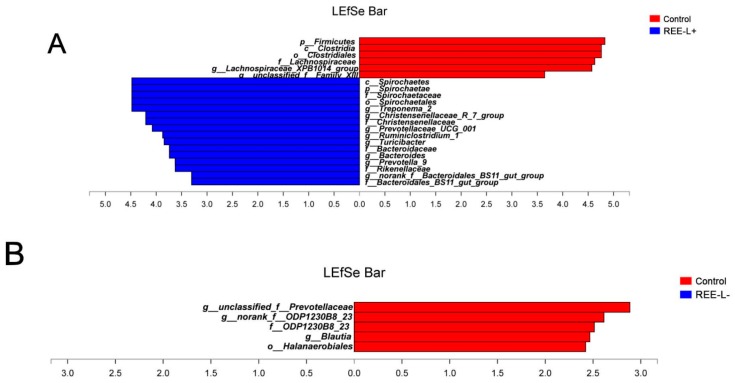
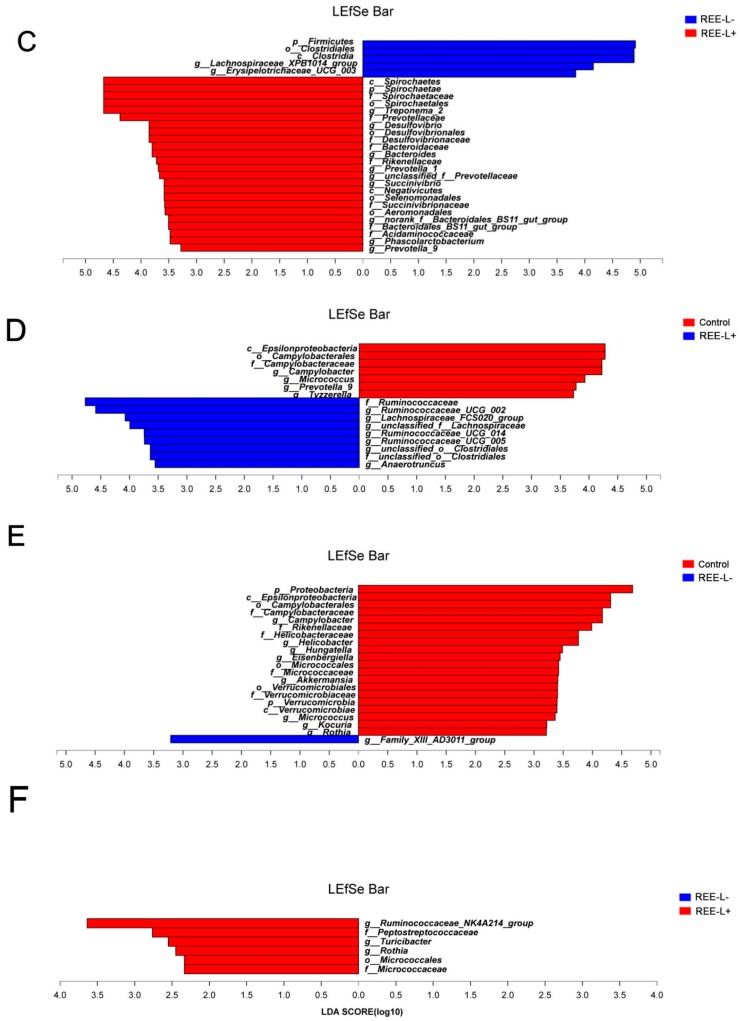
Figure 5.
Linear discriminant analysis effect size (LEfSe) analysis of the different abundance of microbiota in fecal samples of (A–C) sows and (D–F) their piglets from phylum to genus levels. Histograms of a linear discriminant analysis (LDA) score (threshold > 2) are plotted. n = 8 per group. REE-L+, REE supplied during gestation and lactation. REE-L-, REE supplied in late gestation.


