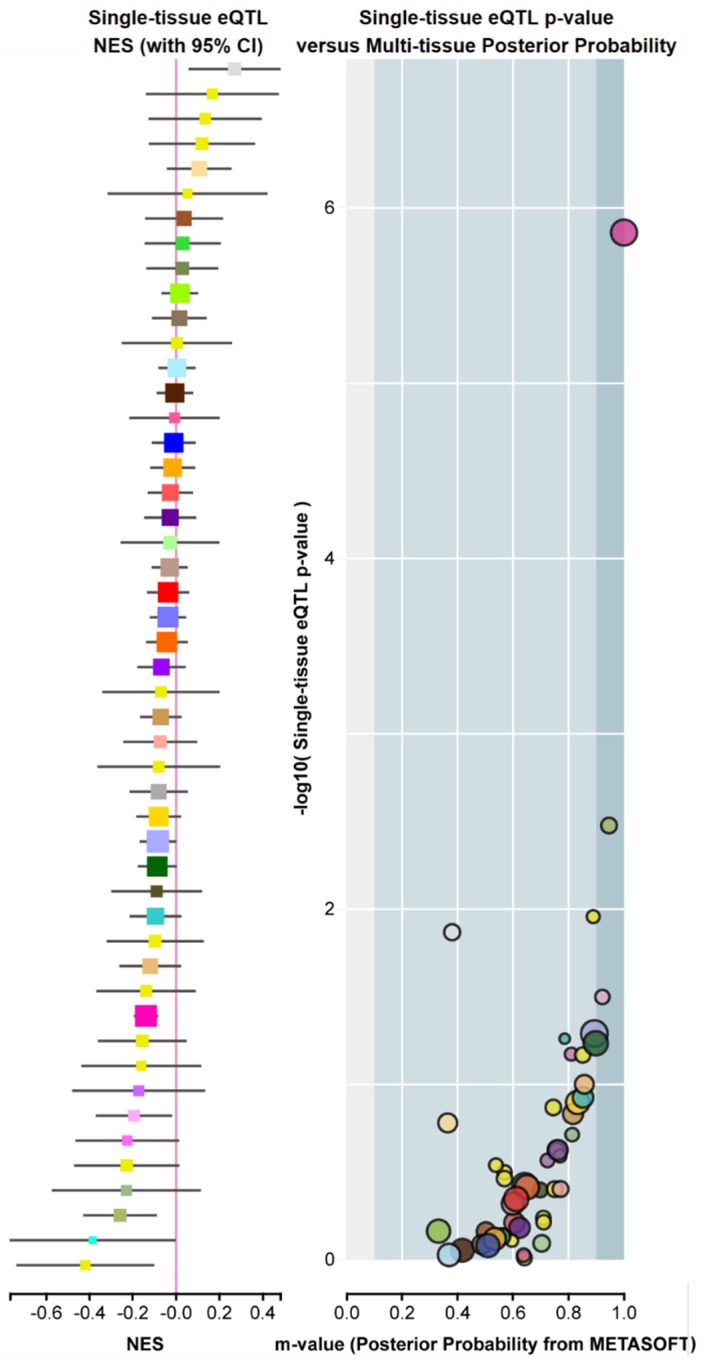
Figure 6.
Example of FADD expression quantitative trait loci (eQTLs), or FADD genetic variants exhibiting high correlation with changes in gene expression. Screenshot from GTEx Portal showing, for variant ID chr11_70241122_G_GCTT_b38, SNP rs559543475, single-tissue eQTL normalized effect size (NES) with 95% confidence interval (left) and Single-tissue eQTL p-value vs. Multi-tissue posterior probability (right). The Y axis indicates the −log10 of p-value (obtained from a t-test that compares observed beta from single-tissue eQTL analysis to a null beta of 0). The X axis indicates the m-value, which indicates the posterior probability that an eQTL effect exists in each tissue tested in the cross-tissue meta-analysis. The m-value ranges between 0 and 1 and is interpreted as follows: m-value < 0.1 indicates that the tissue is predicted to not have an eQTL effect; m-value > 0.9 indicates that the tissue is predicted to have an eQTL effect; otherwise, the prediction of the existence of an eQTL effect is ambiguous [58]. Normalized effect size (NES): the slope of the linear regression of normalized expression data versus the three genotype categories using single-tissue eQTL analysis, representing eQTL effect size. The normalized expression values are based on quantile normalization within each tissue, followed by inverse quantile normalization for each gene across samples. Colors represent distinct tissue categories.

