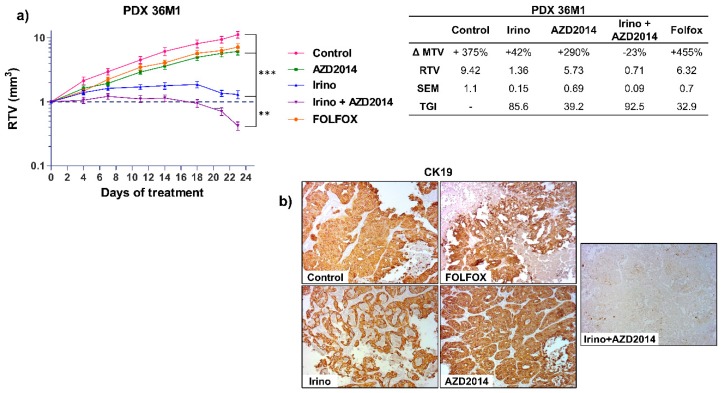
Figure 4.
In vivo effect of irinotecan (Irino) and AZD2014 combination on tumor growth of PDX 36M1. (a) Relative tumor volume (mean RTV ± standard deviation) as a function of time for the PDX36M1. Each group consisted of 7 subcutaneous xenografted mice. The table summarizes the ΔMTV, RTV, and TGI for each group between the beginning and the end of treatment. ΔMTV (%): variation of the mean tumor volume between day 1 and the end of the treatments. RTV: Relative tumor volume. SEM: Standard error of mean. TGI (%): Tumor growth inhibition. (b) Immunostaining of PDX 36M1 tissue sections for CK19 at the end of treatments. The images are representative of all tumors from each group (magnification x100). The treatment schedules were as follows: irinotecan (Irino) (IP, 10 mg/kg/day q5d); AZD2014 (oral gavage, 20 mg/kg BID, 2 days on/5 days off); FOLFOX (5FU: 50 mg/kg, q7d, IP, LV: 90 mg/kg, q7d, IP, oxaliplatin: 6 mg/kg, q7d, IP). Control mice received no treatment. ** p < 0.005, *** p < 0.0005.

