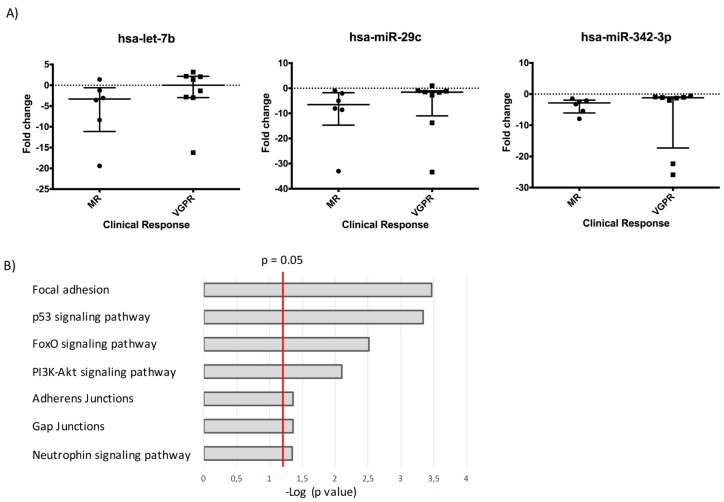
Figure 3.
A three exo-miRNAs signature differentiates MR and VGPR patients. (A) Dot plot graphs show the FC values after induction chemotherapy of each exo-miRNAs for each MR (minor responders) and VGPR (very good partial responders) patient. The median and the interquantile range values are reported. In VGPR patients let-7b, miR-342-3p, and miR-29c are not modulated, while in MR patients they are downregulated. (B) Result of the pathway analysis performed with miRNet showing the enrichment of several pathways related to cancer development and chemoresistance. The bar chart reports the most significantly enriched pathways, listed by decreasing p values, that are relevant for tumor progression and survival.

