
Fig. 7.
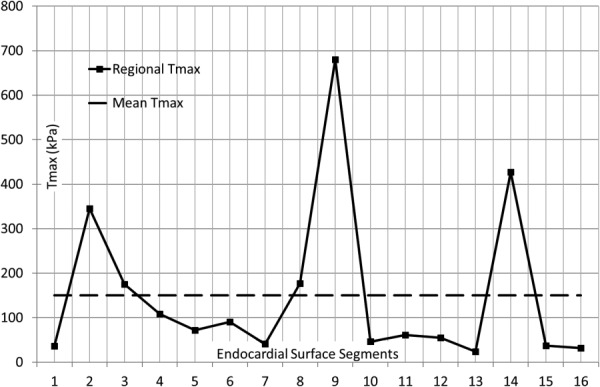
The segmental and mean Tmax in the LV model. In the basal segments, the largest deviation from mean Tmax occurred at segment 2; in the mid LV, the largest deviation from mean Tmax occurred at segment 9. In the apical segments, the largest deviation from mean Tmax occurred at segment 14.