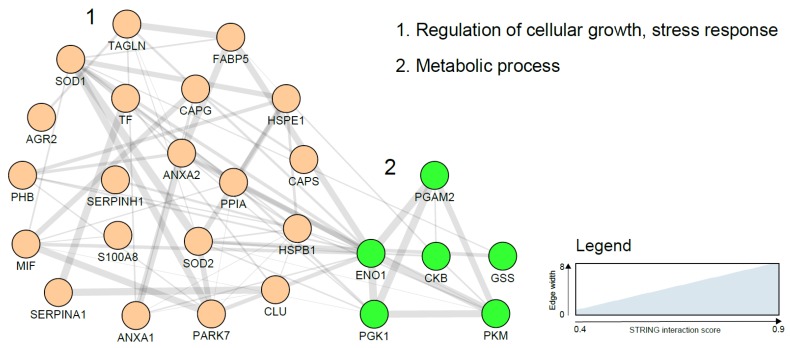
Figure 2.
Endometrial cancer tissue based biomarker correlation network based on a STRING network analysis using gene names and visualised with the Cytoscape software (https://cytoscape.org/). Line thickness indicates strength of the interactions. Protein biomarkers were clustered using the MCL algorithm and subjected to functional enrichment. On the right, the biological processes describing the functions of the candidates are indicated. Costars family protein (ABRACL), Desmin (DES), Fibrinogen beta chain (FBG) and polymeric immunoglobulin receptor precursor (PIGR) did not show any previously reported interaction and are not included in the figure above.

