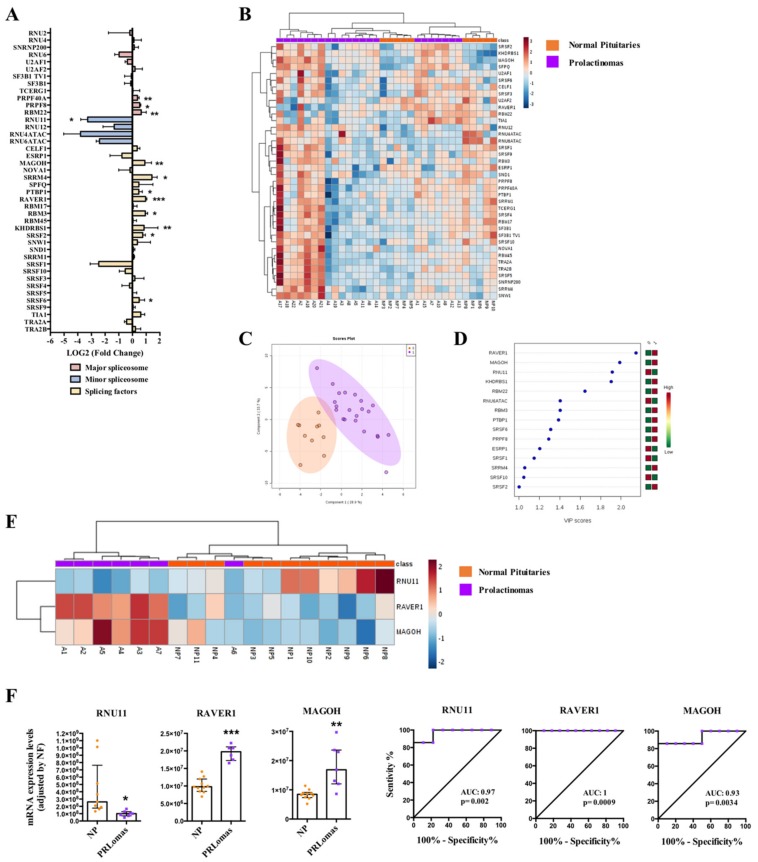
Figure 4.
Prolactinomas (PRLomas). (A) Individual Fold-Change of each splicing-regulatory element expression levels in PRLomas compared to normal pituitary glands (NPs). (B) Heatmap of the mRNA expression levels of all splicing-regulatory elements measured in the qPCR array in PRLomas (n = 7; green color) compared to NPs (n = 11; red color). (C) Principal Components Analysis (PCA) of the mRNA expression levels of the splicing-regulatory elements analyzed in the same set of samples. (D) Variable Importance in Projection (VIP) Scores top-feature of Partial Least Squares Discriminant Analysis (PLS-DA). (E) Heatmap of the splicing-regulatory elements with higher VIP score in the same set of samples. (F) mRNA expression levels of splicing-regulatory elements with higher VIP score in PRLomas compared to NPs and Receiver Operating Characteristic (ROC) curves analyses showing the accuracy of the selected splicing-regulatory elements to discriminate between PRLomas and NPs. Data represent median ± interquartile range of absolute expression levels (copy number) of each transcript adjusted by a normalization factor. Asterisks (* p < 0.05; ** p < 0.01, *** p < 0.001) indicate statistically significant differences between groups.

