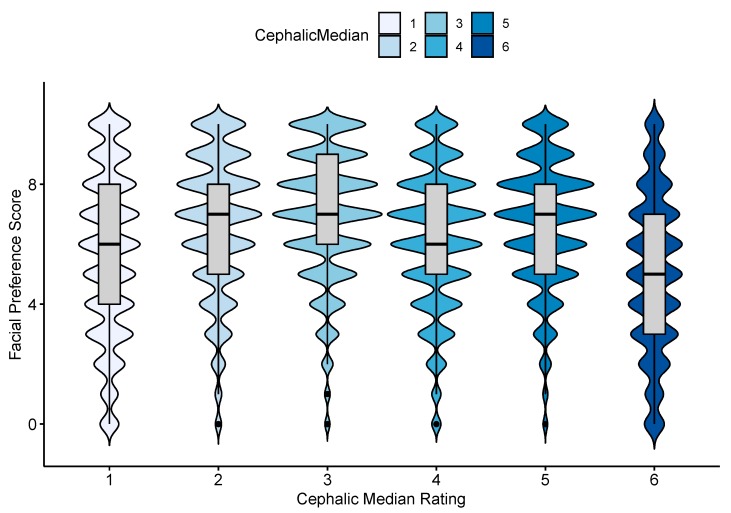
Figure 1.
The distribution of the preference ratings assigned to rabbit face images by 20,858 people, within each of the six cephalic rating groups. The data are displayed as violin plots (where the width indicates the frequency of scores given) with boxplots inside showing the interquartile range and median. Cephalic groups range from 1 “Extremely-brachycephalic”, to 4 “Mesocephalic” and 6 “Moderate-dolichocephalic”. The preference ratings range from 0 (“I don’t like this rabbit at all”) to 10 (“This is my favourite type of rabbit”).

