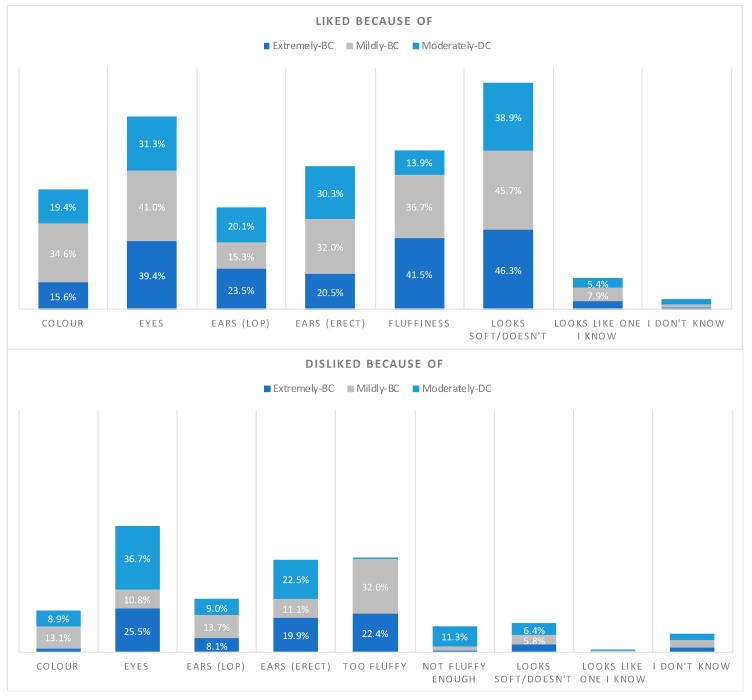
Figure 2.
The proportion of times each reason (excluding Face Shape) was selected for assigning a high preference score (‘liking’, range 7–10) or low preference score (‘disliking’, range 0–3) to rabbits in the cephalic groups Extremely-BC, Mildly-BC and Moderately-DC (the y-axis has been made the same between both graphs to allow for comparison). Note that each person was able to select multiple reasons, so they were not mutually exclusive. The category ‘ears’ was calculated separately, depending on whether the rabbit in the image had lop or erect ears. For visual clarity, percentage values below 5.0% are not written.

