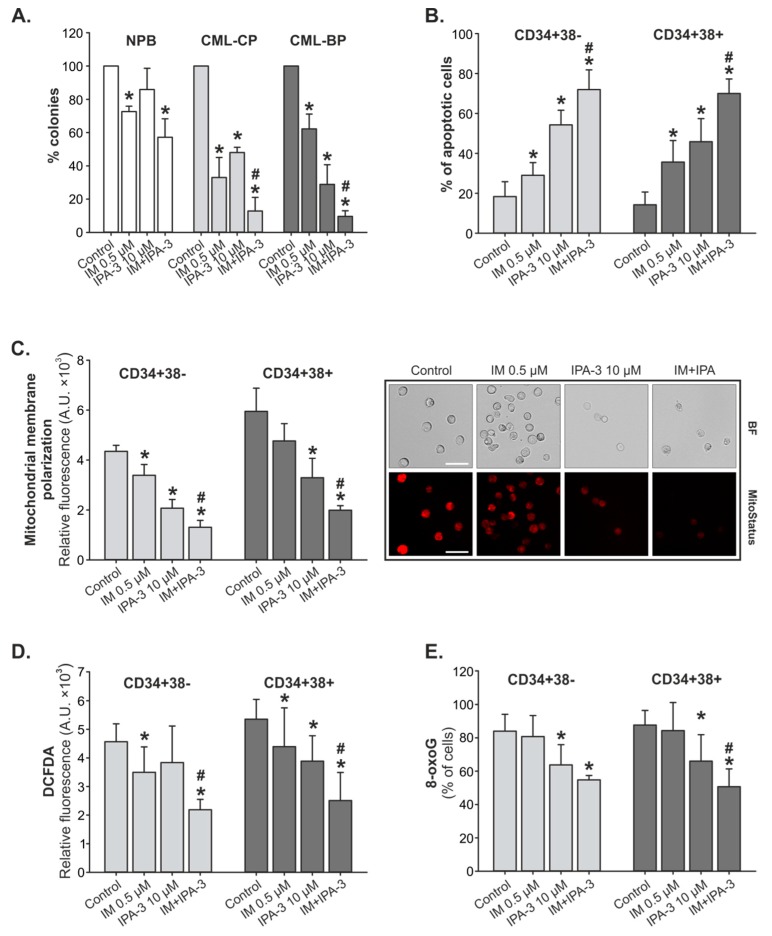
Figure 3.
Effect of combination of IM and IPA-3 on primary chronic myeloid leukemia (CML) cells. (A) Clonogenic assay. Lin¯CD34+ primary cells obtained from healthy donors (NPB, n = 3) and from patients with chronic myeloid leukemia in the chronic phase (CML-CP) (n ≥ 5) and CML-BP (n = 3) were incubated with IM, IPA-3, and their combination for 72 h in the presence of growth factors. Mean percentage of colonies ± SD from triplicates, * p ≤ 0.01 in comparison to control (C), and # p ≤ 0.01 in comparison to IM using one-way analysis of variance Student–Newman–Keuls Method. (B) Apoptosis detection. Mean intensity of annexin V-fluorescein isothiocyanate (FITC)/propidium iodide (PI) staining ± SD (n = 8). * p ≤ 0.004 in comparison to (C) and # p ≤ 0.001 in comparison to IM. (C) Mitochondrial membrane potential. Mean fluorescence intensity (MFI) of MitoStatus Red ± SD (n = 3), * p < 0.008 in comparison to (C), # p < 0.003 in comparison to IM. Representative microphotographs present Lin¯CD34+ primary cells obtained from patients with CML-CP were treated with IM, IPA-3, and their combination for 24 h. A decrease in red fluorescence intensity reflects loss of mitochondrial membrane potential visualized under a fluorescent microscope ZOE Fluorescent Cell Imager, magnification 70×, scale bar 28 µm. (D) Intracellular level of reactive oxygen species. Mean 2’,9’-dichlorodihydrofluorescein-diacetate (DCFDA) staining ± SD (n ≥ 5), * p < 0.05 in comparison to (C). (E) DNA damage. Mean 8-oxoguanine (8-oxoG) fluorescence ± SD (n ≥ 5), * p < 0.05 in comparison to (C), # p < 0.02 in comparison to IM.

